
Fig. 1.
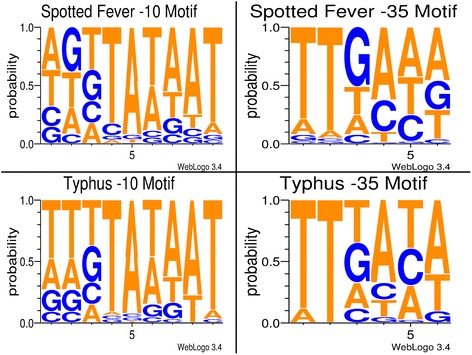
sRNA promoter frequencies. Conservation diagrams illustrating the probability of a nucleotide in a specific promoter motif position. The left side demonstrates the −10 promoter motif, while the right side is the −35 promoter motif. The upper portion displays the typhus group, while the lower displays the spotted fever group. Both groups have −10 motifs similar to the E. coli consensus sequence (TATAAT). On the other hand, the −35 motifs vary when compared to the E. coli consensus sequence (TTGACA)