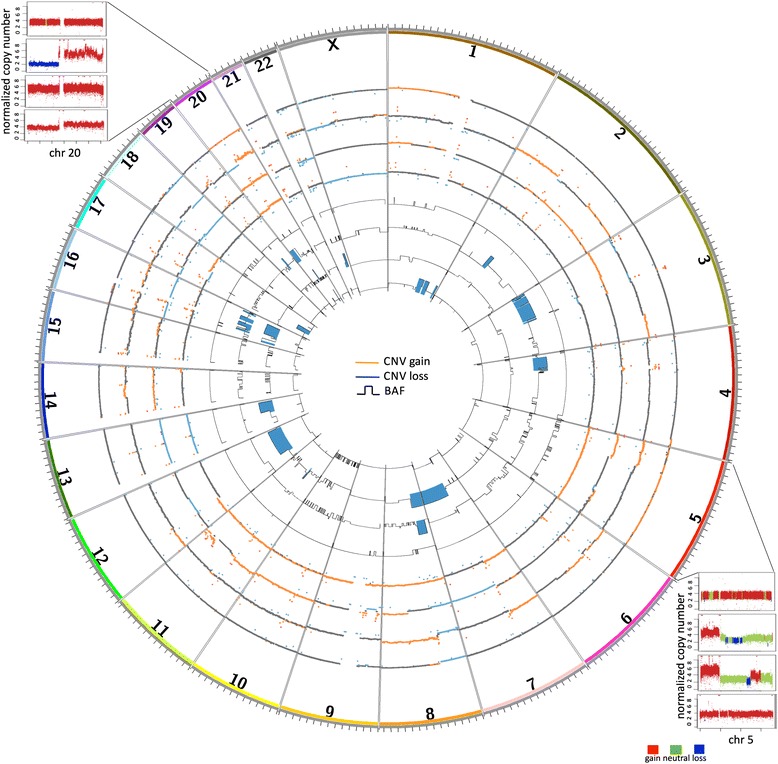
Fig. 1.

Regions of copy number variation and loss of heterozygosity. A circos plot depicting, from the outer ring inward, tumor CNV, THJ-29T CNV, THJ-21T CNV, THJ-16T CNV, tumor LOH, THJ-29T LOH, THJ-21T LOH and THJ-16T LOH. Red and blue CNV regions illustrate the regions of copy gain and loss, respectively. The LOH tracks illustrate the B Allele Frequencies (BAF) ranging from 0.5 to 1. Those regions with BAF > = 0.9 are highlighted in blue. Regions of 5p and 20q showed recurrent copy gain in all samples
