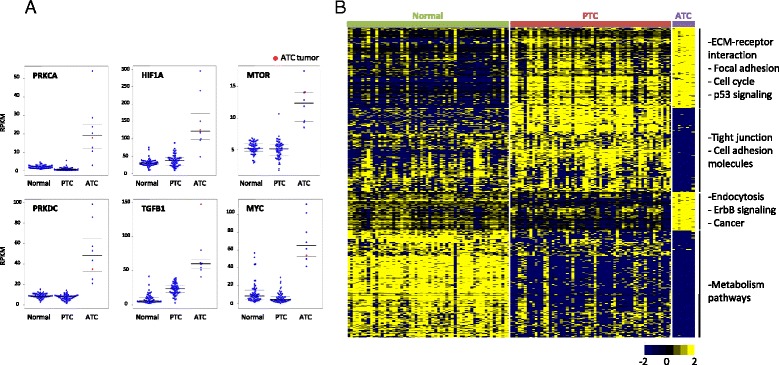
Fig. 3.

Transcriptomic analysis of ATCs a. The expression levels (RPKM = reads per kilobase per million mapped reads) of select genes in the TCGA and ATC specimens are plotted. Median, first and third quartile values are marked for each distribution b. Samples were ordered on the basis of pathology and 1647 significantly expressed genes in 58 TCGA normal thyroid tissue transcriptomes, 58 TCGA papillary thyroid cancer transcriptomes and 8 anaplastic thyroid cancer transcriptomes were clustered
