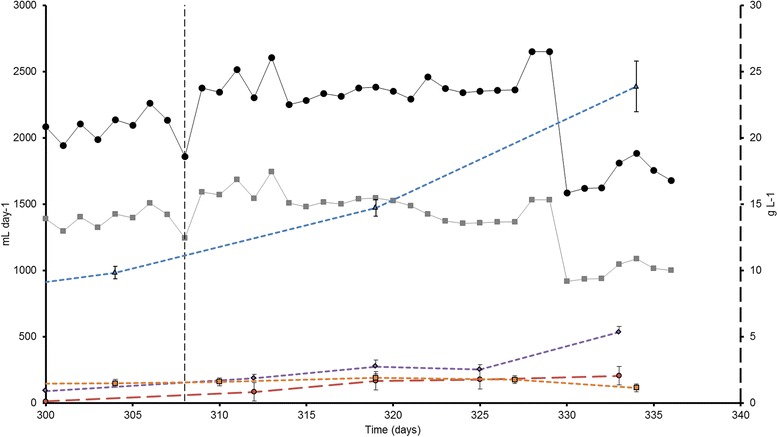
Fig. 1.

Biogas, methane production and sludge characteristics. Left axis: daily biogas (Black-●) and methane (Gray-■) production normalized to standard temperature and pressure conditions (20 °C; 0 atm); Right axis: Soluble COD (Blue- ∆); acetic acid (Purple- ◊); propionic acid (Red-o), NH3-N (Orange-■) obtained from the anaerobic digestion of Spirulina. Vertical dashed line indicates a change in the organic loading rate from 4.0 g Spirulina L−1 day−1 to 5.0 g Spirulina L−1 day−1
