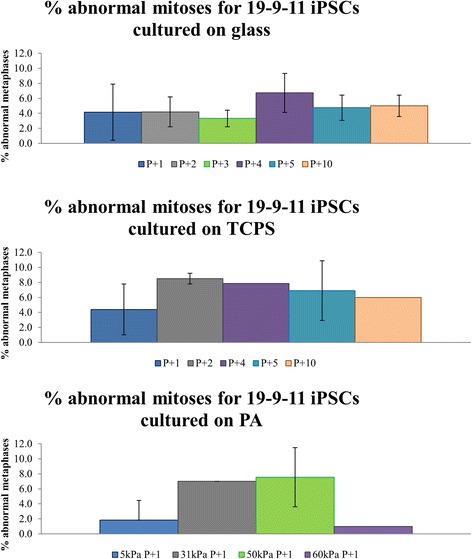
Fig. 3.

Frequency of abnormal mitoses for 19-9-11 iPSCs cultured on glass, TCPS and PA hydrogels. Bar plot for 19-9-11 iPSCs cultured on glass show percent of abnormal mitoses for 5 consecutive passages and passage 10. Plot for TCPS shows quantification for passages 1, 2, 4, 5 and 10. Passage 3 was unable to be quantified due to contamination. Quantification for PA hydrogels was done only for one passage. n = 26–132 mitoses per condition for 1–5 independent experiments done. Passage number since derivation for this cell line ranged from passage 34–55
