Fig. 2.

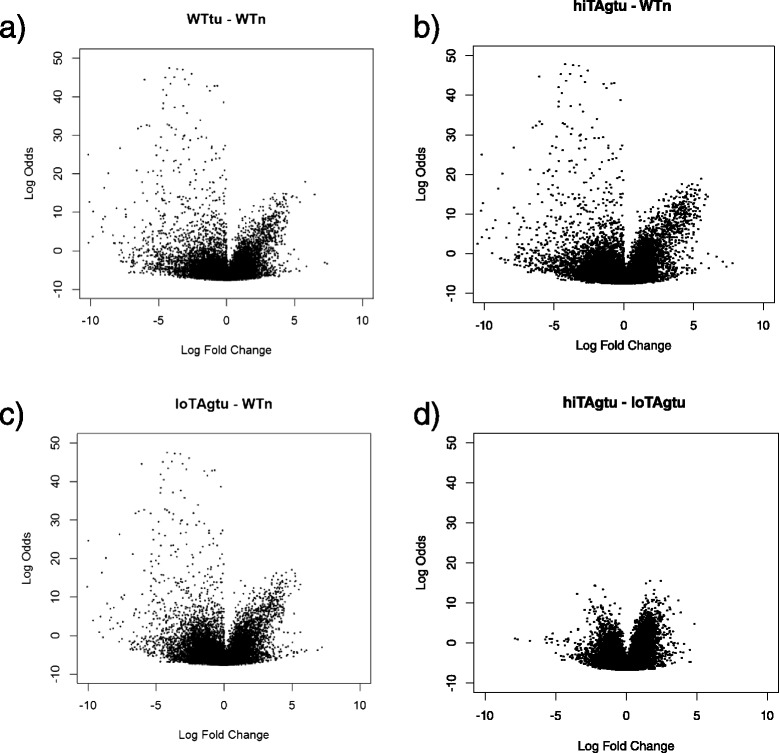
Volcano plots of log-fold change versus log-odds of the differential probe-set expression showing comparative expression levels between sample groups. a WTtu and WTn (b) hiTAgtu and WTn, (c) loTAgtu and WTn and (d) loTAgtu and HiTAgtu

Volcano plots of log-fold change versus log-odds of the differential probe-set expression showing comparative expression levels between sample groups. a WTtu and WTn (b) hiTAgtu and WTn, (c) loTAgtu and WTn and (d) loTAgtu and HiTAgtu