Fig. 3.

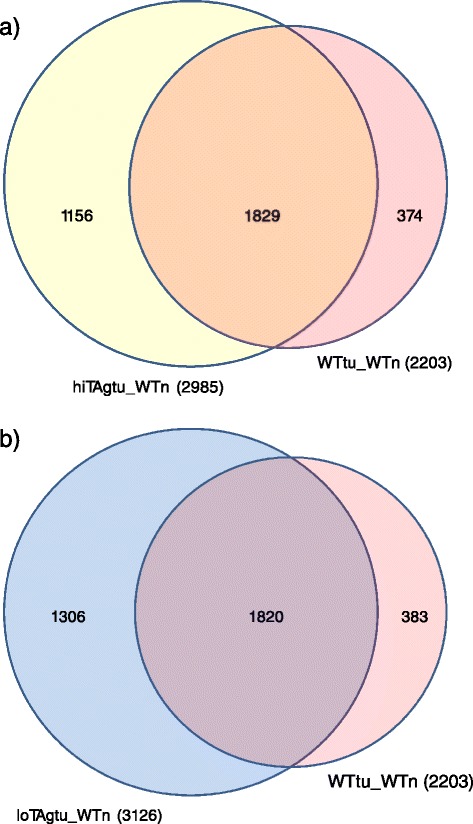
Proportional Venn diagram indicating the number of genes that are common to both sets of differentially expressed gene comparisons (a) HiTAgtu_WTn and WTtu_WTn, (b) loTAgtu_WTn and WTtu_WTn

Proportional Venn diagram indicating the number of genes that are common to both sets of differentially expressed gene comparisons (a) HiTAgtu_WTn and WTtu_WTn, (b) loTAgtu_WTn and WTtu_WTn