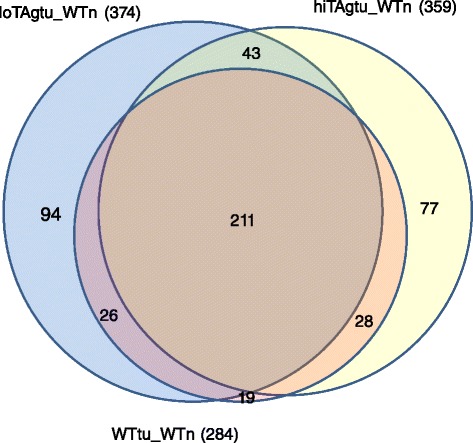
Fig. 6.

Differentially expressed genes in common between human and mouse mesotheliomas compared to their mesothelial counterpart. Figure shows a proportional Venn diagram indicating the number of overlapping genes that are commonly differentially expressed in each of the three tumour sets, as labeled, compared to the human mesothelioma-human mesothelial differential set (Htu_Hn)
