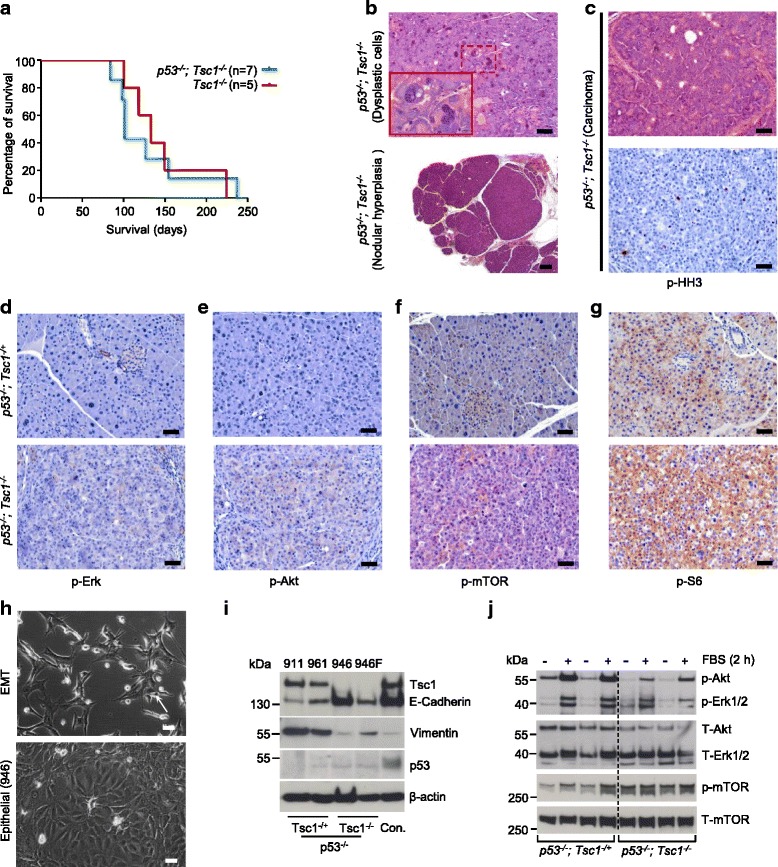
Fig. 3.

Loss of p53 and Tsc1 promote acinar cell transformation. (a) Kaplan–Meier survival analysis shows p53 -/-; Tsc1 -/- mice survival time (median survival: 101 days; n = 7) which is not different from that of Tsc1 -/- mice (median survival: 133 days; n = 5); (b) Representative H&E-stained sections of p53 -/-; Tsc1 -/+ and p53 -/-; Tsc1 -/- pancreata show pancreatic acinar cells with nuclear abnormalities (upper panel) and nodular hyperplasia (lower panel); scale bar: 50 μm (upper panel) and 200 μm (lower panel); (c) Representative H&E-stained sections and IHC pictures show the histology of one ACC-like tumor with a high proliferative index (p-HH3); (d-g) Representative IHC pictures show distinct in vivo activation of mTOR signaling (p-mTORSer2448 and p-S6Ser235/236), but inactivation of Erk (p-Erk1/2Thr202/Tyr204) and Akt (p-AktSer473) in tumor cells (and atypical acinar cells) of pancreatic tissues from p53 -/-; Tsc1 -/- mice, scale bar: 50 μm; (h) Phase contrast images of isolated cell lines from p53 -/- ; Tsc1 -/+ (911 and 961) and p53 -/- ; Tsc1 -/- (946 and 946 F) mice show fibroblast-like (961, 911 and 946 F) and epithelial (946) morphologies, scale bar: 50 μm; (i) Western-blot analysis demonstrates expression of Tsc1, E-Cadherin, Vimentin and p53 in p53 -/- ; Tsc1 -/+ and p53 -/- ; Tsc1 -/- cells; previously described cystic cells lines isolated from P48 Cre/+ ; Pten -/- ; Tsc1 -/+ mice were used as used as external controls [18]; (j) Western-blot analysis demonstrates phosphorylation levels of p-AktSer473, p-Erk1/2Thr202/Tyr204 and p-mTORSer2448 in p53-/- ; Tsc1 -/+ and p53 -/- ; Tsc1 -/- cells after fetal bovine serum (FBS) treatment for 2 h; one of the three independent experiments is shown
