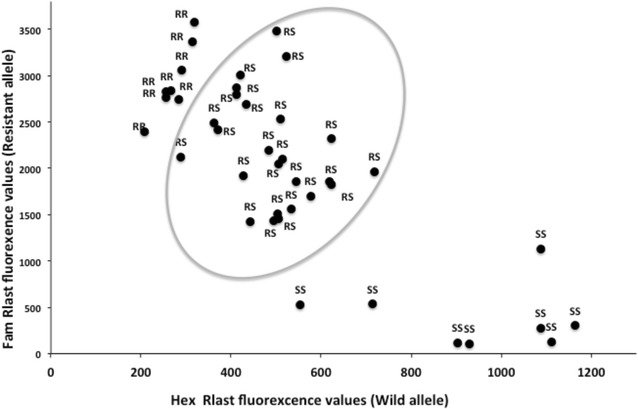
Fig. 1.

Scatter plot analysis of TaqMan fluorescence data. dRlast fluorescence values of the FAM labelled probe (specific for the Ace-1 R mutation) are plotted against the HEX labelled probe (specific for the wild type Ace-1 S allele). RR, genotype Ace-1 RR; RS, genotype Ace-1 RS; SS, genotype Ace-1 SS. The circle indicates the limit of heterozygous specimens
