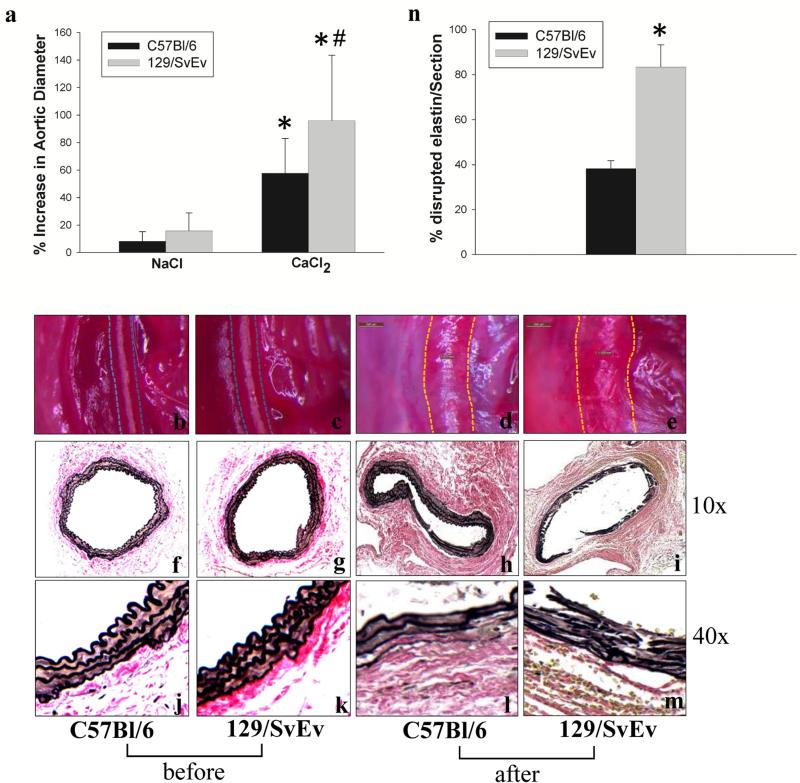
Figure 1. Aortic changes after NaCl and CaCl2 treatment in C57Bl/6 and 129/SvEv mice.
Aortic diameters were measured before NaCl or CaCl2 incubation and at sacrifice. Aortic diameter increases are shown in the bar graph (a). Bars represent the mean +/−SD of at least 6 mice per group. The diameter in the CaCl2-treated groups was increased significantly at sacrifice in both C57Bl/6 and 129/SvEv mice compared to NaCl treated mice (* P < .01). The aortic dilatation in CaCl2-treated 129/SvEv mice was significantly greater compared to CaCl2-treated C57Bl/6 mice (# P < .05). Photographs (b-e) show the mouse aortas in C57Bl/6 and 129/SvEv mice with the dotted line indicating the outer border of the aortas before (b, c) and after (d, e) CaCl2 aneurysm induction, respectively, (n = 6-10/group). VVG staining for elastic fibers (f-m). Aortic lamellae disruption (10× magnification) (h, i) and elastic fiber fragmentation (40× magnification) (l, m) were more severe in 129/SvEv (i. m) than in C57Bl/6 (h, l) mice (n = 3-5/group). n, percentage of aortic circumference showing elastin disruption in CaCl2-treated C57Bl/6 and 129/SvEv mice (n = 3 aortas/group).

