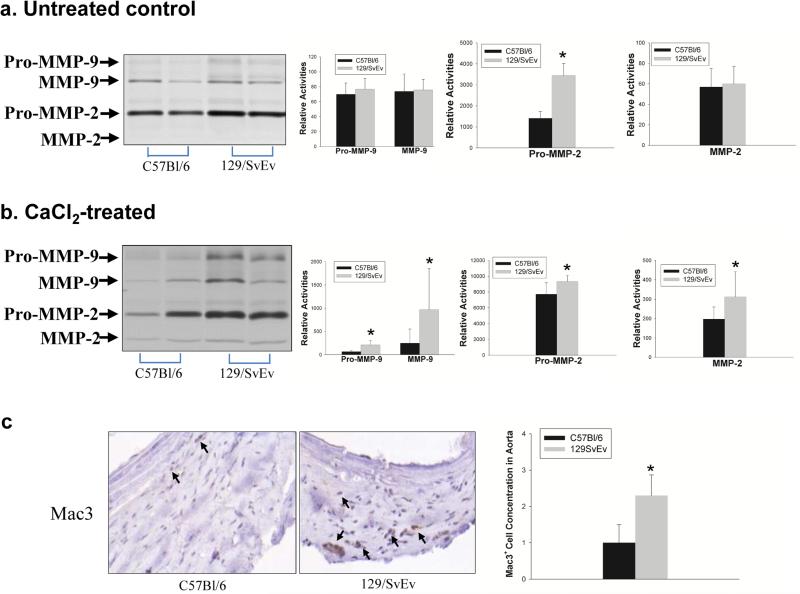
Figure 4. Aortic MMP-2 and MMP-9 expression.
Gelatin zymography analysis of MMP activities expressed in the aortas of C57Bl/6 and 129/SvEv mice, a) Untreated controls; b) CaCl2-treated mice. Representative zymogram gels are shown in left panels. Relative levels of pro-MMP-9, MMP-9, pro-MMP-2, MMP-2 in mouse aortas were quantified and data shown in the bar graphs (* P < .05). c) Representative immunoperoxidase staining for macrophages of aneurysmal aortic tissues from C57Bl/6 and 129/SvEv mice. Mac3-positive cells are indicated by arrows. Macrophages in aortic tissue were evaluated and scored with values from 0-3 as previously described (7). Zero indicates that there were no Mac3-positive cells, 3 indicated many Mac3-positive cells in a limited area, and 1 and 2 were used to classify intermediate grades of Mac3 positive cells (n = 3/group).

