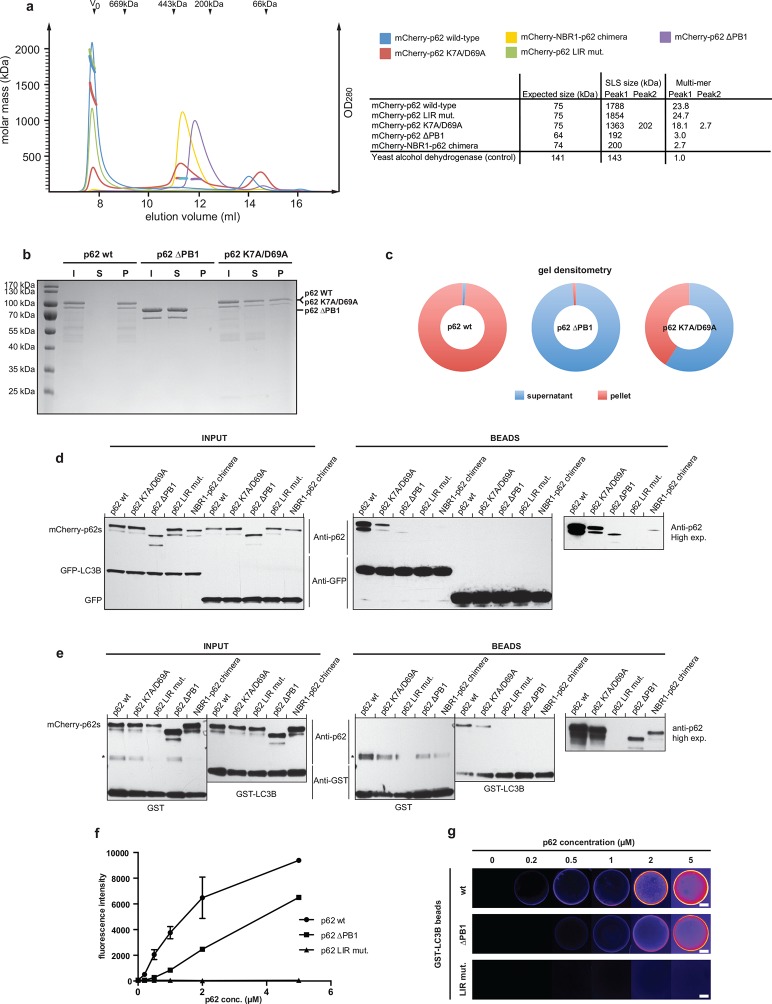
Figure 2. Oligomerization of p62 stabilizes binding to LC3B-coated surfaces.
(A) Size exclusion chromatography (SEC) and static light scattering (SLS) analysis of recombinant wild-type mCherry-p62, the LIR mutant and the oligomerization mutants (K7A/D69A, delta PB1, and NBR1-p62 chimera). The left Y-axis indicates the molecular weight of the protein as determined by SLS. The average sizes of the indicated peak areas obtained by SLS are shown in the table. See Figure 2 for gel. (B) Coomassie-stained gel showing a p62 sedimentation assay of recombinant mCherry-p62 wild-type, delta PB1, and K7A/D69A mutants. For each p62 variant input, supernatant and pellet fractions were loaded. (C) Quantification of the p62 sedimentation assay shown in (B). Amounts of p62 in the supernatant (blue) and pellet (red) are represented as fractions of the input. (D) Anti-GFP and anti-p62 western blot of input (8%) and bead (50%) fractions of a GFP-TRAP affinity purification of HeLa cell lysates co-expressing GFP-LC3B or GFP (control) and the mCherry-p62 variants. The endogenous p62 was silenced by siRNA treatment (Figure 2—figure supplement 2). A representative blot of four independent replicates is shown. (E) Anti-GST and anti-p62 western blot analysis of input (8%) and bead (16%) fractions of a pull-down experiment using GST-LC3B or GST (control) as bait and purified mCherry-p62 variants as prey. A representative blot of three independent replicates is shown. Asterisks denote dimeric GST. (F) Quantification of steady-state binding intensities of increasing concentration of wild-type, delta PB1, or the LIR mutant mCherry-p62 on GST-LC3B-coated beads. The average fluorescence intensity on the beads is plotted against the p62 concentration. Averages and SD of three independent experiments are shown. (G) Representative images of the experiment shown in (FSchematic represen). The mCherry signal is shown in false color (ImageJ: fire). (F) Total beads quantified: wild-type 0.2 µM = 187 - 0.5 µM = 198 - 1 µM = 180 - 2 µM = 175 - 5 µM = 73; p62 delta PB1 0.2 µM = 133 - 0.5 µM = 163 - 1 µM = 179 - 2 µM = 176 - 5 µM = 58; p62 LIR mutant 0.2 µM = 74 – 0.5 µM = 84 – 1 µM = 75 – 2 µM = 85 – 5 µM = 75.
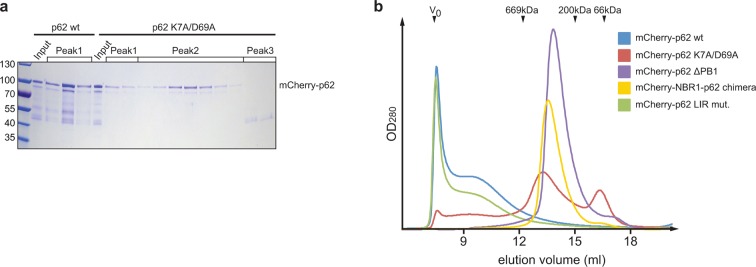
Figure 2—figure supplement 1. (A) Coomassie-stained gel showing the peak fractions of wild-type mCherry-p62 and the K7A/D69A mutant after the size exclusion chromatography (SEC)/static light scattering (SLS) runs.
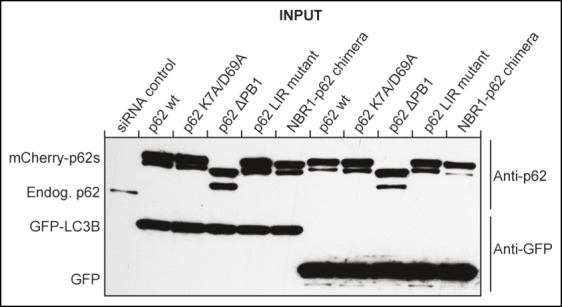
Figure 2—figure supplement 2. Western blot of samples shown in Figure 2D showing efficient siRNA-mediated silencing of endogenous p62 in mCherry-p62 co-transfected cells.

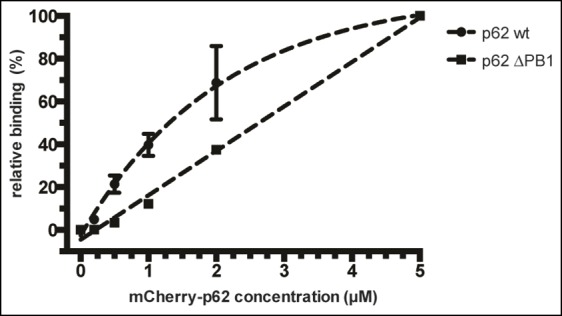
Figure 2—figure supplement 3. Relative fluorescence intensity plot of data shown in Figure 2F.


