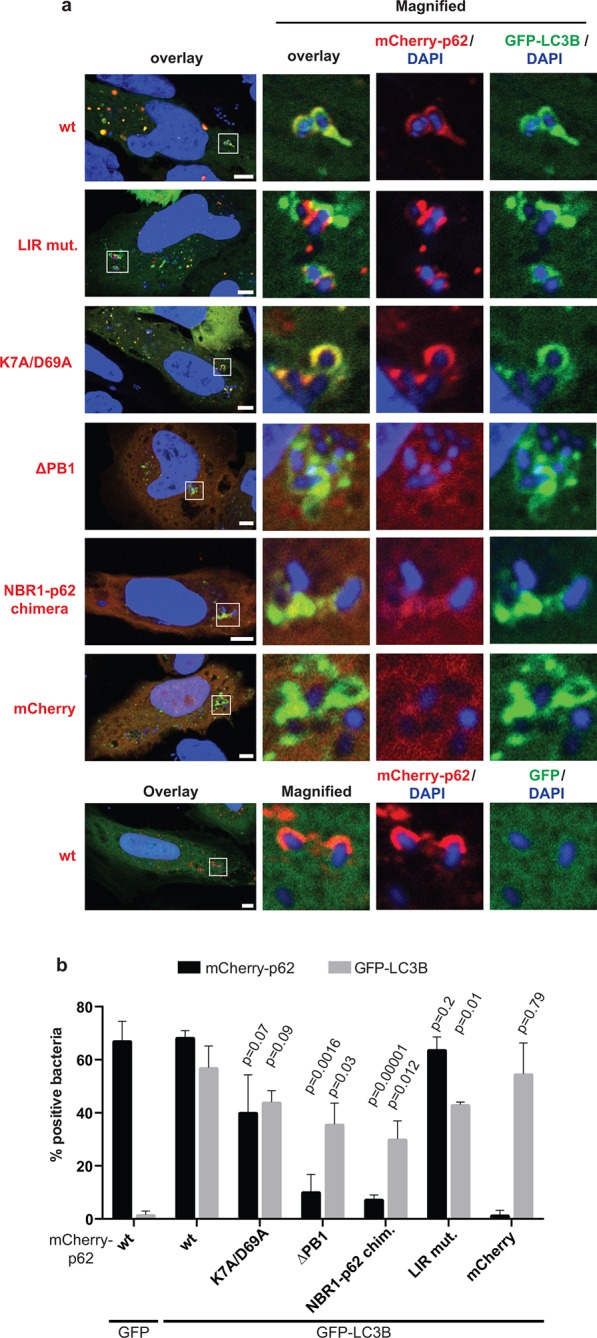
Figure 7. Oligomerization of p62 is required for efficient recruitment of p62 to Salmonella typhimurium in HeLa cells.
(A) Representative pictures of HeLa cells co-expressing GFP-LC3B and mCherry-p62 infected with S. typhimurium. The endogenous p62 was silenced by siRNA. Magnifications of the insets are shown on the right. Pictures of whole cells are shown in Figure 7—figure supplement 1. Scale bars, 5 µm. (B) Quantification of mCherry-p62- and/or GFP-LC3B-positive bacteria. Averages and SD of three independent replicates are shown. Indicated p-values were calculated with a two-tailed unpaired Student’s t-test. Values above the black bars refer to the wild-type mCherry-p62 value in the wild-type mCherry-p62 + GFP-LC3B sample; values above the gray bars refer to the GFP-LC3B value in the same sample. (B) Total bacteria counted per condition: mCherry-p62 wild-type + GFP-LC3B = 245, mCherry-p62 K7A/D69A + GFP-LC3B = 337, mCherry-p62 LIR + GFP-LC3B = 287, mCherry-p62 delta PB1 + GFP-LC3B = 296, mCherry-NBR1-p62 chimera + GFP-LC3B = 292, mCherry + GFP-LC3B = 318, mCherry-p62 wild-type + GFP = 325

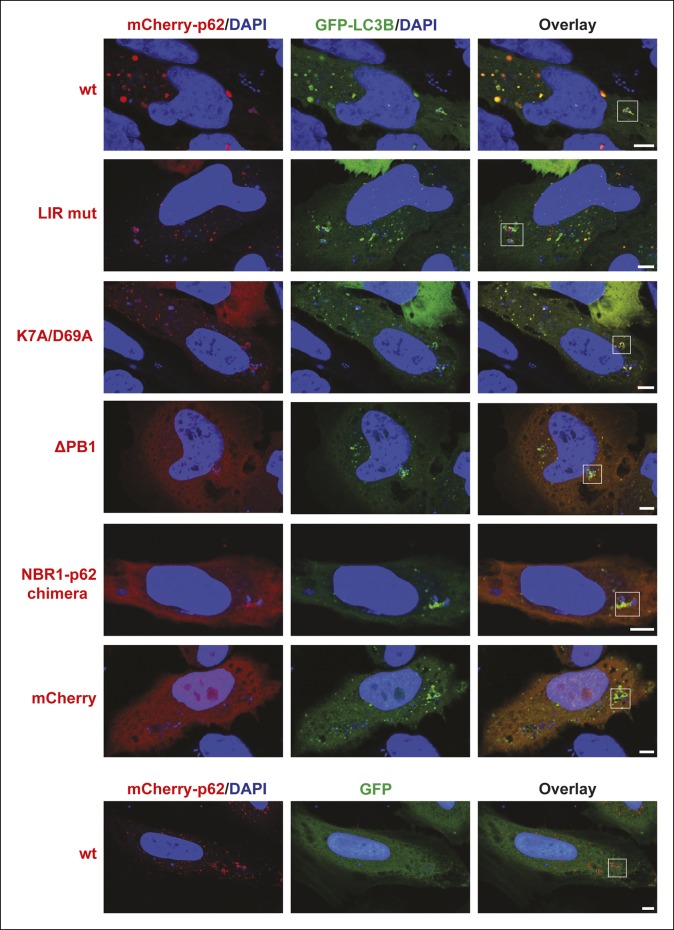
Figure 7—figure supplement 1. Full-size pictures of the data shown in Figure 7A.
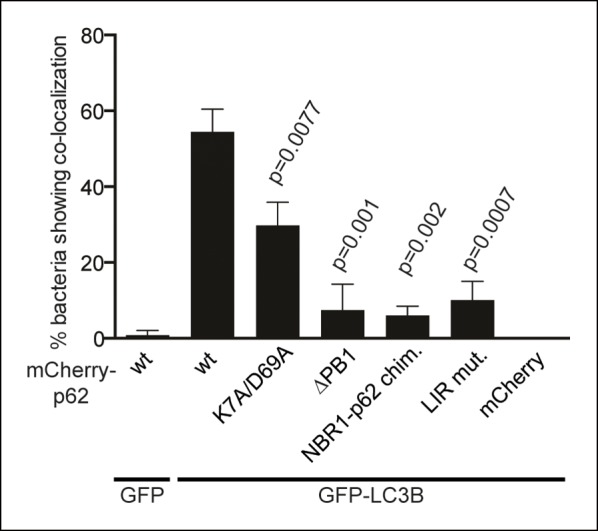
Figure 7—figure supplement 2. Quantification of co-localization of the indicated mCherry-p62 variants and GFP-LC3B at bacteria.


