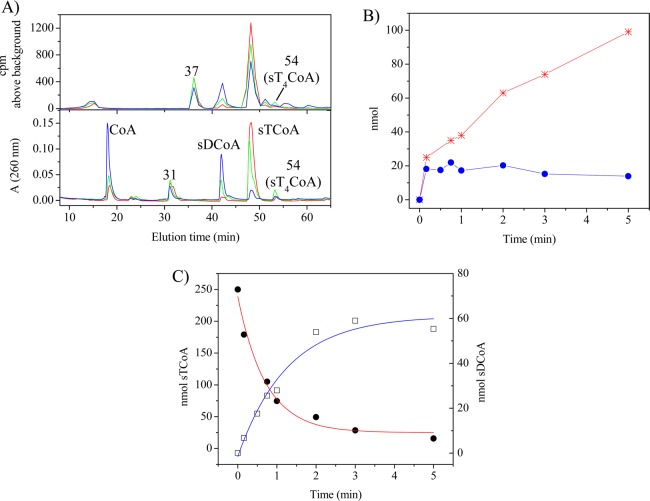
Figure 3.
Products of the reaction of PhaCCc with [3H]sTCoA. (A) Overlays of HPLC traces of aliquots taken after incubation for 10 s (red), 45 s (green), and 5 min (blue). The peak of radioactivity at 37 min was present in the control. Peaks are labeled as they are described in the text. (B) Amount of CoA (red stars) and [3H]sT associated with PhaC (blue, filled circles) as a function of time. (C) Disappearance of [3H]sTCoA (red, filled circles) and formation of [3H]sDCoA (blue, empty squares) as a function of time.

