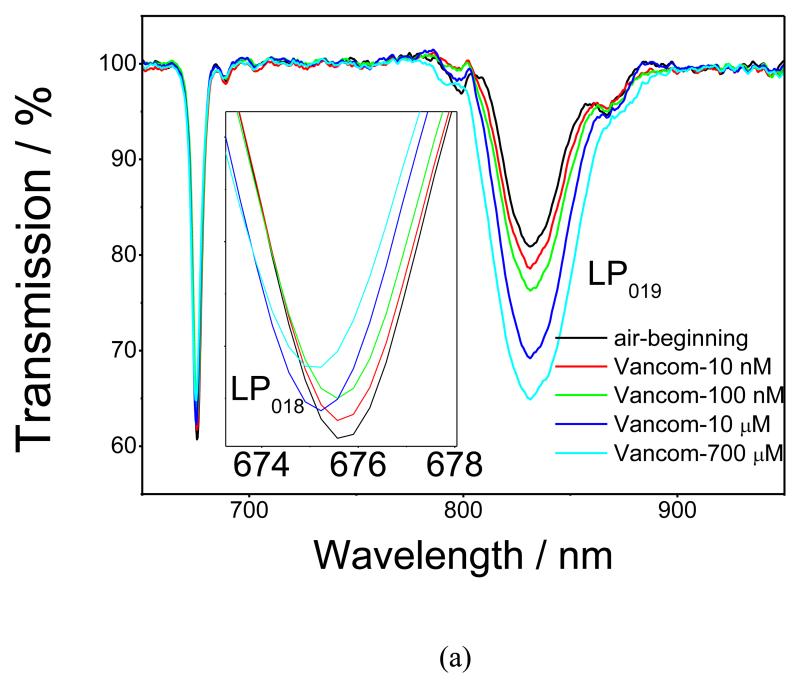
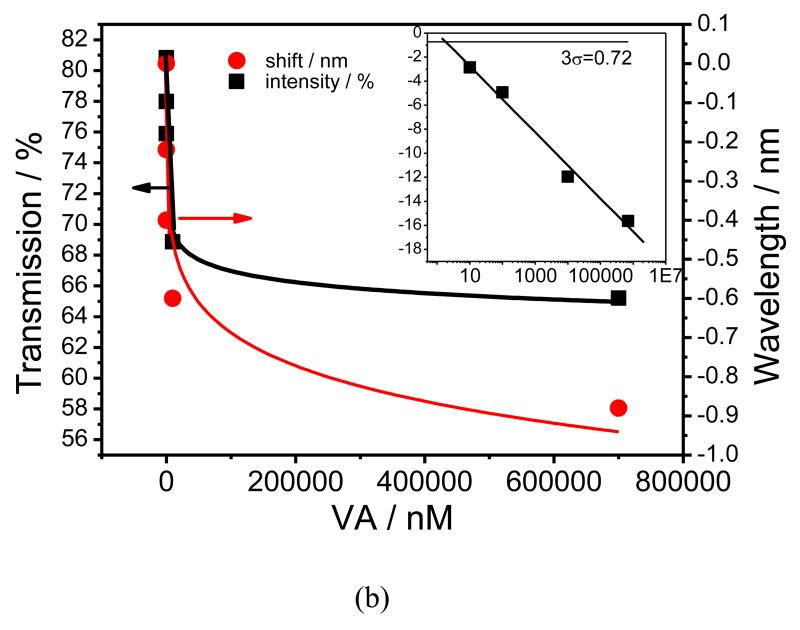
Figure 3.
(a), TS of the nano-MIP coated LPG measured in air after exposure to VA concentrations ranging from 10 nM to 700 μM; (b), Dependence of the transmission at the centre of the resonance band corresponding to coupling to the LP019 mode (square) and wavelength shift of the resonance band corresponding to coupling to the LP018 mode (circle) on the concentration of VA. The red and black lines are fits using the Langmuir adsorption isotherm. The inset shows the logarithmic dependence of transmission at the centre of the resonance band corresponding to coupling to the LP019 mode on VA concentration.


