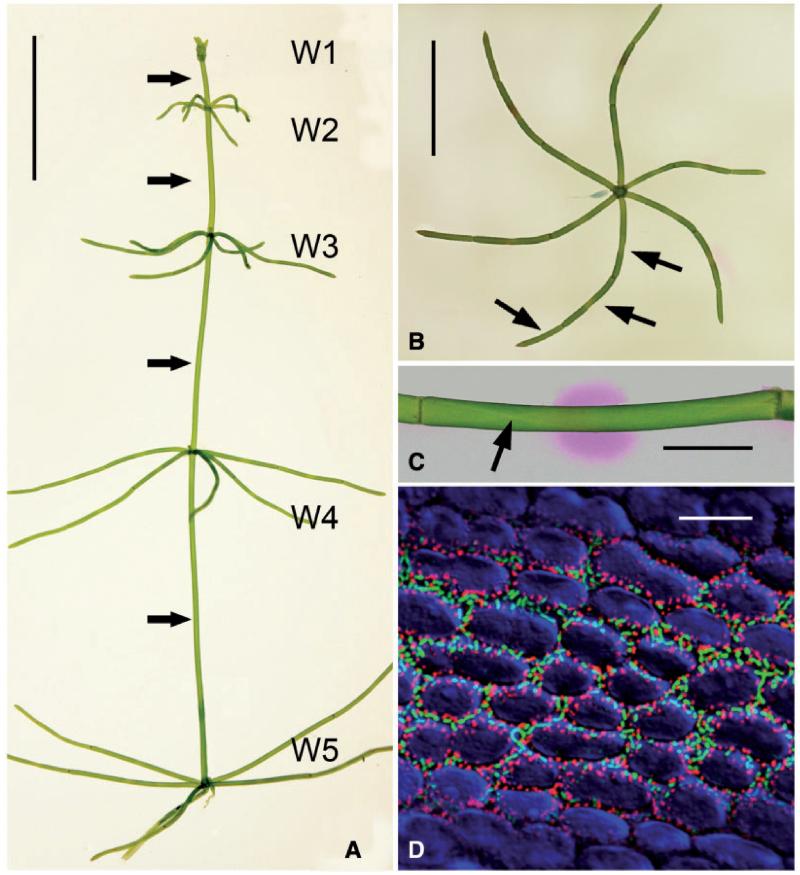
Fig. 1.
The characean thallus, pH banding and cortical cytoplasm of branchlet internodal cells. (A) Thallus of Chara australis with five whorls (W1–W5) separated by internodal cells of the main axis (arrows). (B) Isolated whorl corresponding to W4 in (A). Arrows indicate positions of branchlet internodal cells. (C) Internodal cell of a branchlet incubated in phenol red to show the pH banding pattern (the pink region indicates alkaline pH). The arrow points to the neutral line. (D) Fluorescence micrograph showing charasomes at an acid region stained with green fluorescent FM1-43 and mitochondria stained with red fluorescent mitotracker orange. Chloroplasts are false colored blue. Scale bars = 1 cm (A, B), 1 μm (C) and 10 μm (D).

