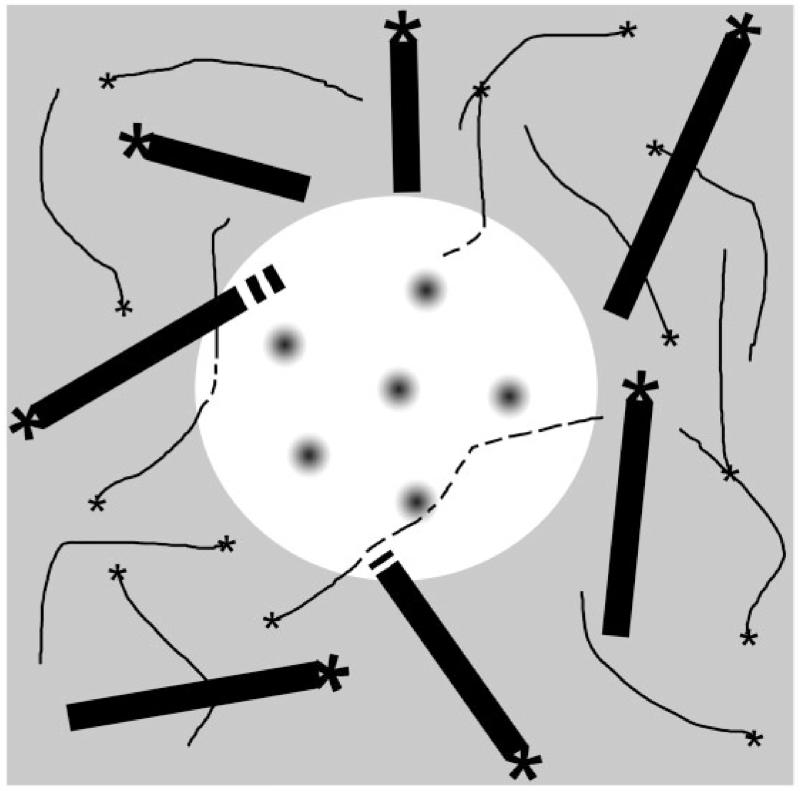
Fig. 12.
Schematic view onto the cytoplasmic surface of a charasome (white) and the adjacent smooth plasma membrane (gray). Gray circles represent the openings of the charasome cytoplasmic surface into the labyrinth of charasome tubules. Black bars represent microtubules, and thin lines represent actin filaments; asterisks indicate putative microtubule and actin-nucleating centers. Broken lines indicate depolymerization of actin filaments and microtubules beneath the charasome.

