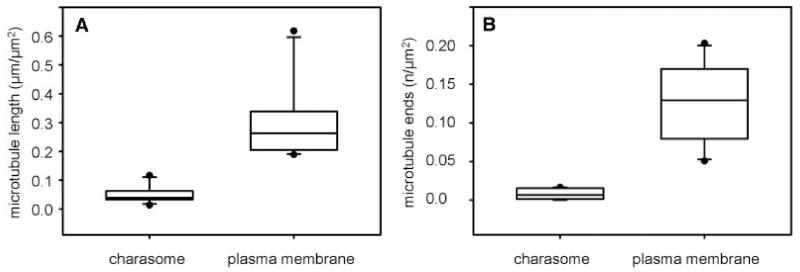
Fig. 3.
(A) Relative microtubule lengths and (B) relative number of microtubule ends and branchings at the smooth plasma membrane and at charasomes are compared in box-and-whisker plots. Shown are median values with upper and lower quartiles (boxes), whiskers indicating the 10th and 90th percentiles, and outliers (dots) with n = 15 for each plot. Differences between median values are significant (Mann–Whitney rank sum test, P≤0.001).

