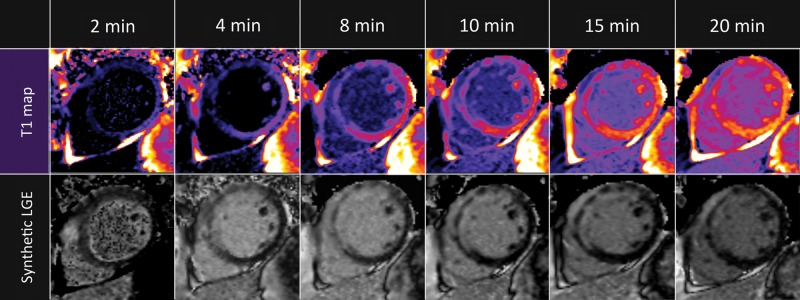
Figure 5.
T1 maps and synthetic LGE images in a patient with non-transmural infarction. At 4 min, the LGE abnormality appears transmural which changes to subendocardial at 15 and 20 min. Post-contrast T1 maps (upper row) after contrast administration and synthetic LGE images (bottom row). Synthetic LGE images are generated from MOLLI T1 data on a pixel-by-pixel basis and displayed at the optimal inversion time to null normal myocardium.

