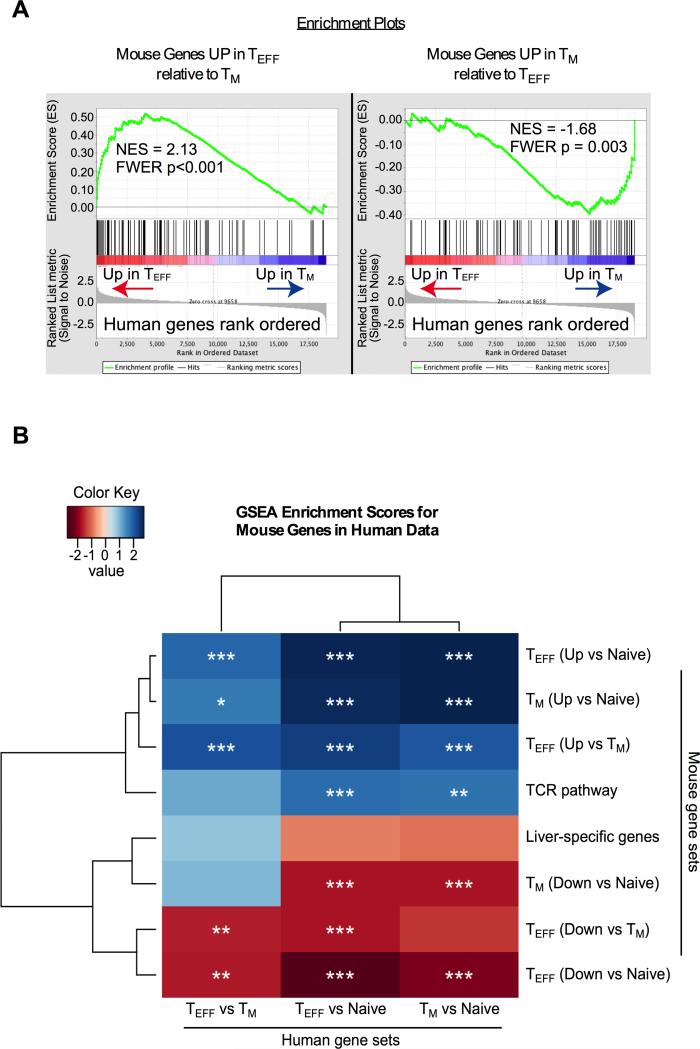
Figure 2. Gene Set Enrichment Analyses reveal significant overlap between the transcriptional profile of CMV-specific T cells in humans and mice.
(A) Gene set enrichment was performed as described in the Methods. Shown are the enrichment plots for mouse genes that differed in a TEFF vs. TM comparison, plotted relative to human TEFF and TM cells. Values represent the normalized enrichment score (NES) and Family Wise Error Rate (FWER), which estimates the probability of a false positive NES. (B) Lists of significantly altered mouse genes (2-fold up or down and P<.05) were generated for TEFF and TM cells relative to each other and relative to naive (CD44low) T cells. GSEA analyses were performed with these mouse gene sets relative to each of the indicated human data sets, rank ordered by expression (see methods). Stars indicate FWER corrected significance to control for multiple testing (* P<.05, ** P<.01, *** P<.001).

