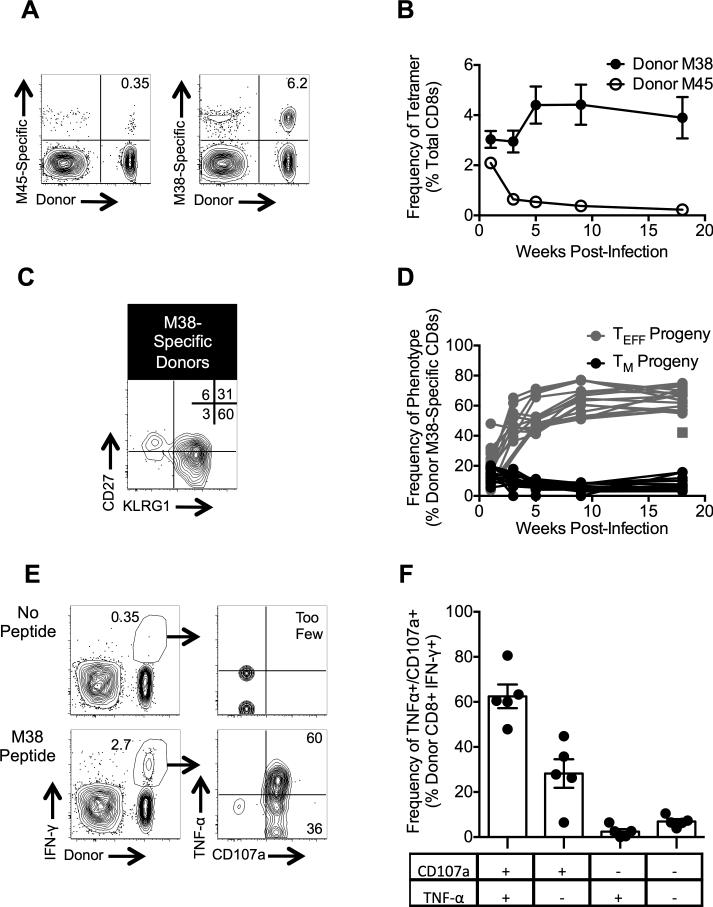
Figure 4. TM cells reinflate following re-challenge and retain function.
Age matched B6 mice received TM cells and were challenged with MCMV as in the Methods. (A) Representative FACS plots of donor-derived T cells in the blood 126 days post-challenge. (B) Frequencies of tetramer-binding T cells in the blood over time. Data were collected from three independent experiments (n = 17 total). (C) Representative FACS plot of the phenotype of donor-derived M38-specific T cells in the blood 126 days post-challenge. (D) Frequencies of donor-derived, M38-specific TM and TEFF cells in the blood over time. Data are from the same experiments described in (B). Each line represents an individual mouse. The square datum point represents a mouse that appeared to lose the donor T cells after day 7 post-challenge, but effectors appeared ~20 weeks after challenge. (E-F) Intracellular cytokine staining was performed on splenocytes 221 days post-challenge. Shown are representative FACS plots of stimulated (with M38 peptide) and unstimulated cells (E) and the frequencies of IFN-γ positive cells that also express TNF-α and/or CD107a (F). Data were collected from a single experiment (n = 5) described above. All graphical data are displayed as mean ± SEM.

