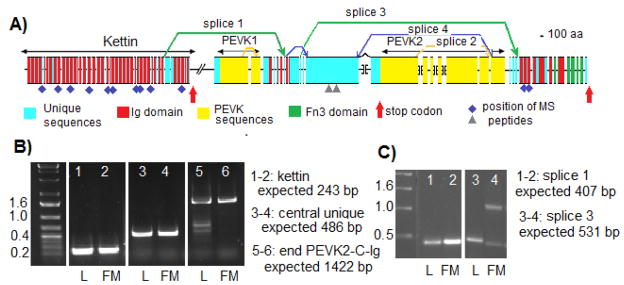
Figure 5.
Exon-intron structure, splicing alternative and domain organization of the sls gene in Manduca sexta. A) D iagram presenting the gene structure and identifying the characterized alternative splicing patterns. The extent of different protein regions are indicated by double head arrows above the map. Introns are not to scale. Brackets indicate gaps in the genomic sequences between individual contigs. B) Gel analysis of RT-PCR products for representative exons. Lanes 1–2 represent the terminal exon of kettin with the reverse primer placed after the stop codon. Lanes 3–4 represent a section of the main large exon for the central unique domain. Lanes 5–6 represent the splice from the last PEVK2 exon to the first Ig domain at the COOH terminus. L: RNA extracted from legs, FM: RNA extracted from flight muscles C) Gel analysis of RT-PCR products for specific splicing pattern. Lanes 1–2 product generated from splice 1 between NH2-terminal Ig domain and beginning of central unique region. Lanes 3–4 product generated from splice 3 between beginning of central unique region and beginning of first Ig domain at the COOH terminus. L: RNA extracted from legs, FM: RNA extracted from flight muscles. Purple diamonds and grey triangles: locations of the peptides identified from mass spectrometry with perfect or strong matches respectively.

