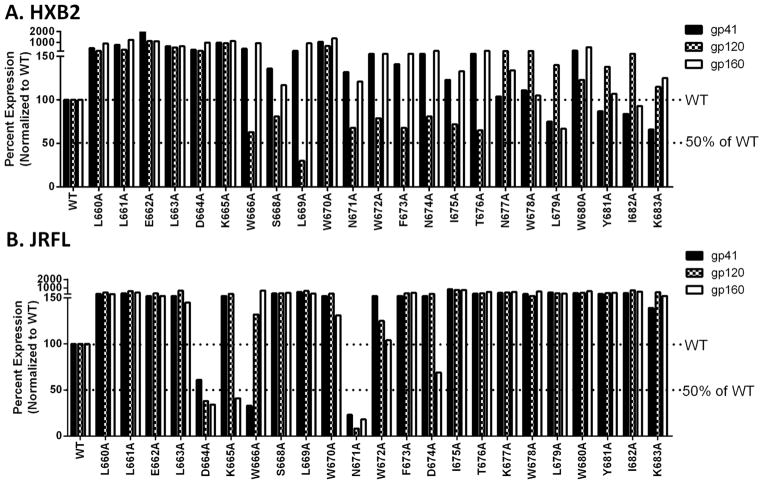
Figure 5. Protein expression level in the lysates of the virus-producing cells.
293T cells were used for producing virus. These cells were lysed and the protein concentration was quantified by BCA assay. Subsequent Western blot analysis was performed using Chessie-8 and anti-gp120 antibodies followed by band quantification as described in Figure 4. Each membrane was reprobed with anti-p24 antibodies and band intensity was quantified. Each band intensity of gp41, gp160, and gp120 was normalized to the p24 level and then normalized again to the WT level of each protein. A) Protein expression level of HXB2 virus producing cells. B) Protein expression level of JRFL virus producing cells.

