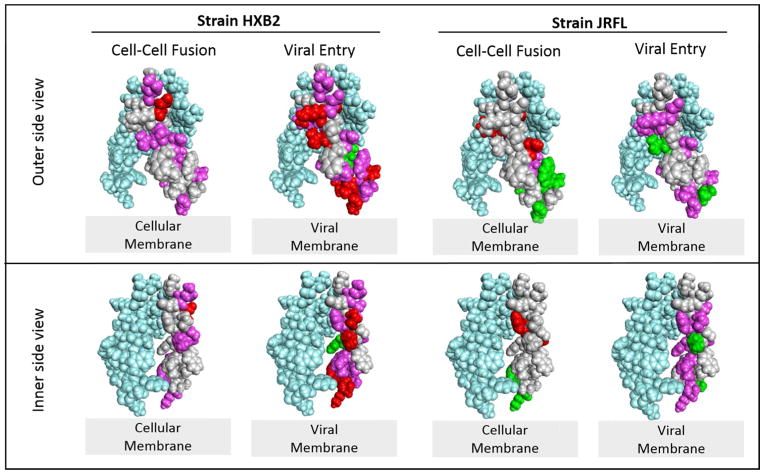
Figure 7. Molecular models highlighting the functionality of mutations in the HIV gp41 MPER.
A membrane associated MPER trimer structure was used to diagram the residues that are either diminished or enhanced in function upon mutation to alanine 38. For simplicity, mutations are indicated only on one of the monomers (light gray) and the other two monomers making up the trimer structure are shown in light blue. The top panel is a view of the outer side of the MPER. The bottom panel is a view that is rotated to display the inner side of the MPER. Amino acid residues without highlighting (light gray) have levels 80–120% of WT. Those colored pink have levels diminished to 20–50% of the WT level. Those colored red have levels diminished to < 20% of the WT level. The residues colored green have levels increased above 120% of the WT level. The structure was rendered with Discovery Studio Visualizer 4.0 based upon the coordinates from the Protein Data Bank entry 2LP7.

