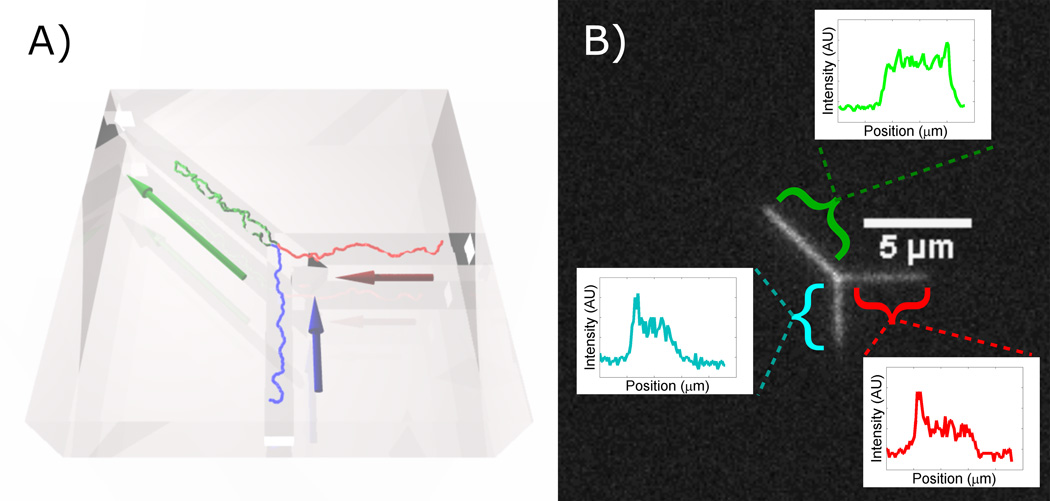
Figure 1.
A simulated DNA molecule trapped at a Y-junction. Arrows indicate direction of pressure driven buffer liquid flow. (B) Fluorescence micrograph of looped DNA at Y-junction. The insets show the fluorescence intensity profiles along the three channels axes: the loop (l), the vertical leg (υ), and the horizontal leg (h).

