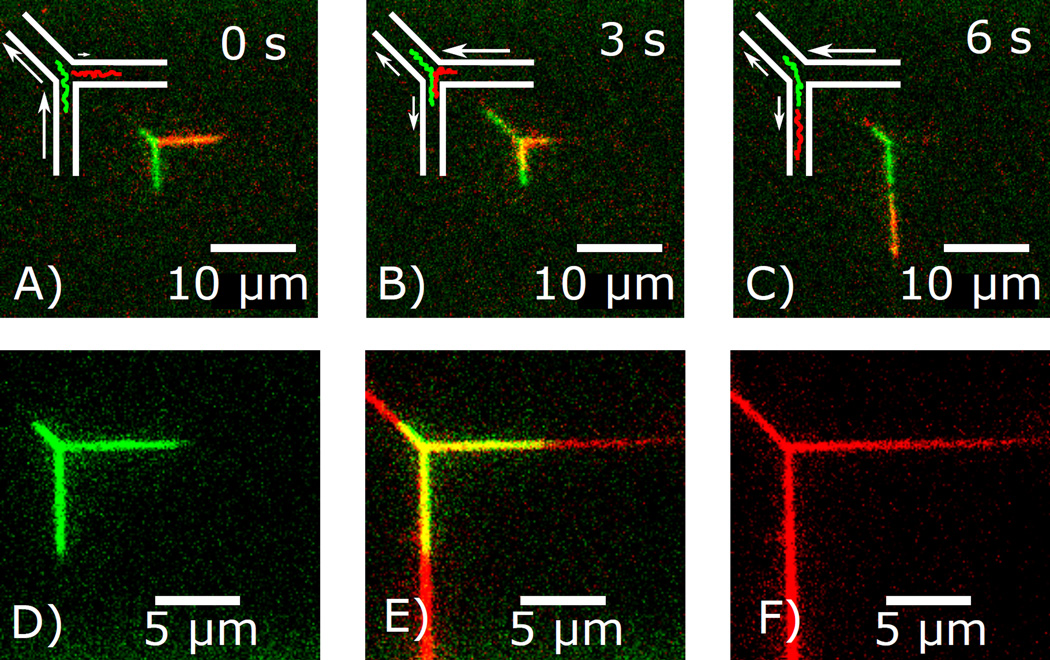
Figure 5.
A)–C) Intermolecular scanning of two DNA molecules via spatial colocation. Schematics and corresponding images of two λ-DNA molecules, one stained with YOYO-1 (green), the other with YOYO-3 (red), being scanned past each other. Inlet pressures are regulated to force the DNA into the desired configurations. D)–F) DNA is regioselectively exposed to fluorescent dye (S640) that is introduced through the υ channel and leaves through the l channel. DNA is green, S640 is red, and we show both individual color images (D,F) and the composite image (E).

