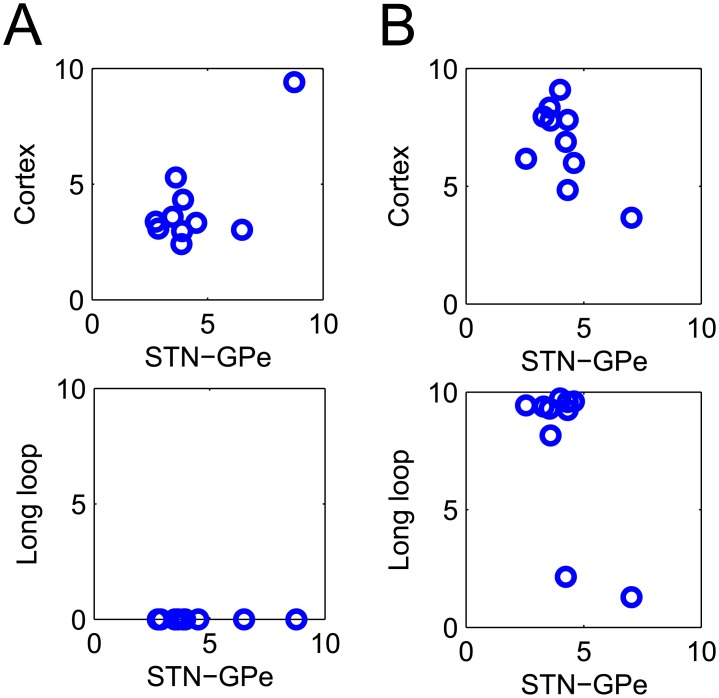
Fig 4. The top ten parameter sets found by the optimisation procedure.
Of interest are the parameter values that represent the STN-GPe circuit, the cortex and the closed basal ganglia-cortical loop. The relationship between these values are shown in the two panels, where each circle represents a solution of the optimisation. A) Resonance model. B) Feedback model.

