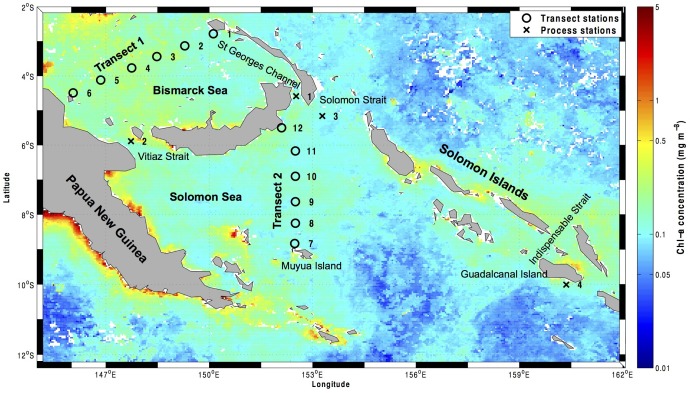
Fig 1. Stations sampled during the MoorSPICE cruise superimposed on a satellite image of chlorophyll a (Chl-a) concentrations.
Chl-a data were obtained from the National Aeronautics and Space Administration (NASA) Goddard Earth Sciences Data and Information Services Center Giovanni (NASA GES DISC) online database for the month of March 2014. Transect stations are numbered from 1 to 12 and depicted by an open circle. Process stations (where DOM enrichment experiments were made) are numbered from 1 to 4 and depicted by a cross.

