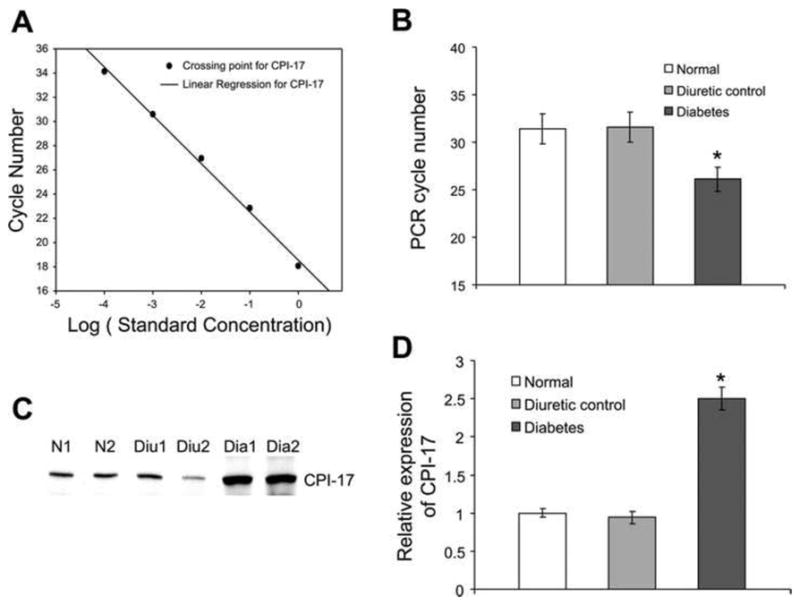
Figure 6. Expression of CPI-17 at both mRNA and protein level.

A: standard curve of real-time PCR for CPI-17. B: average of the PCR results. The required PCR cycle numbers was significantly decreased in diabetic DSM samples compared with normal or diuretic controls. It was 31.4 cycles for normal sample, 31.6 cycles for diuretic controls, and 26.1 cycles for diabetic samples. C: Western blot for CPI-17. D: bar graph showing the relative expression of CPI-17 at the protein level. There was almost a 2.5-fold higher expression of CPI-17 at the protein level in diabetic detrusor compared with normal and diuretic samples. *Significant difference between samples (n = 4, P < 0.01). (Reproduced with permission from Chang et al, 2006.).
