
Figure 7. Selected areas from 2-dimensional (2D) gel showing basal MLC20 phosphorylation in normal, diuretic, and diabetic detrusor smooth muscle (DSM).
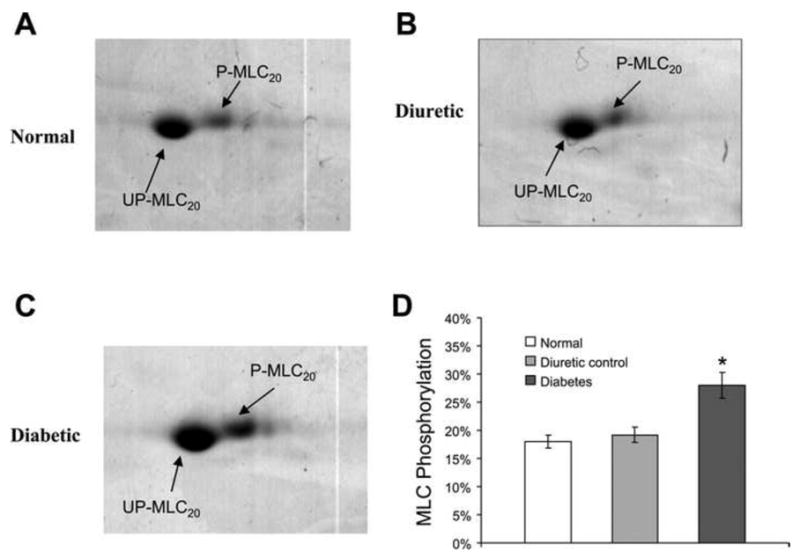
A: normal. B: diuretic. C: diabetic. D: bar graph showing the average values of myosin light chain (MLC) phosphorylation. Phosphorylated MLC20 (P-MLC20) runs slightly higher and more toward the acidic side than unphosphorylated MLC20 (UP-MLC20) in the gel. The basal phosphorylation of MLC20 was 18% in normal DSM. Diuretic control had a very similar level (19.2%) of MLC20 phosphorylation. However, the phosphorylation level was significantly increased to 28% in diabetic detrusor. *Significant difference between samples (n = 3, P < 0.05). (Reproduced with permission from Chang et al, 2006.).