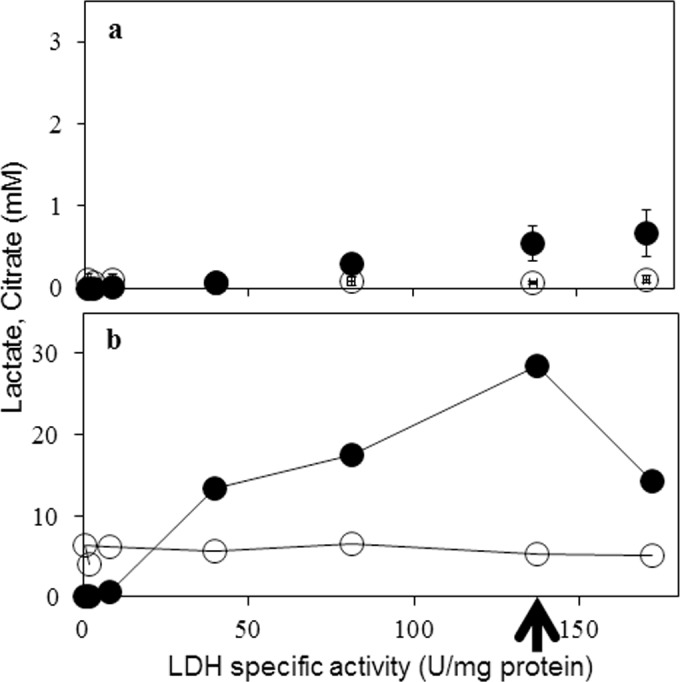
Fig 3. LDH specific activity and lactate and citrate levels in mldhA transformants: Extracellular (Panel a) and intracellular (Panel b) concentrations of L-lactate (filled circles) and citrate (open circles) are shown.

Data in panel b is an average of two measurements. Each LDH specific activity data point represents one individual transformant (see Table 3). Arrow indicates the data for C12 strain.
