
Fig 2. Heatmap showing genes with pregnancy-associated expression patterns that are altered by presence of RA.
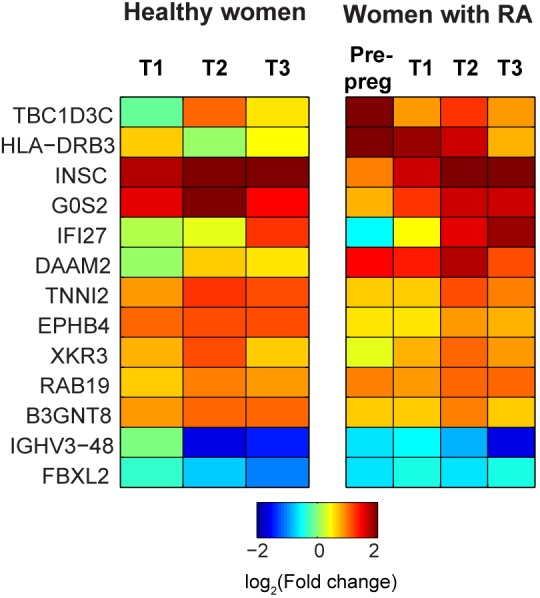
Log-transformed (log2) values of the average fold change in expression compared to baseline (i.e. pre-pregnancy levels among healthy women) are plotted for healthy women and for women with RA. Only genes that exhibited 2-fold or higher change in expression (compared to healthy pre-pregnancy baseline levels) in any trimester are shown.