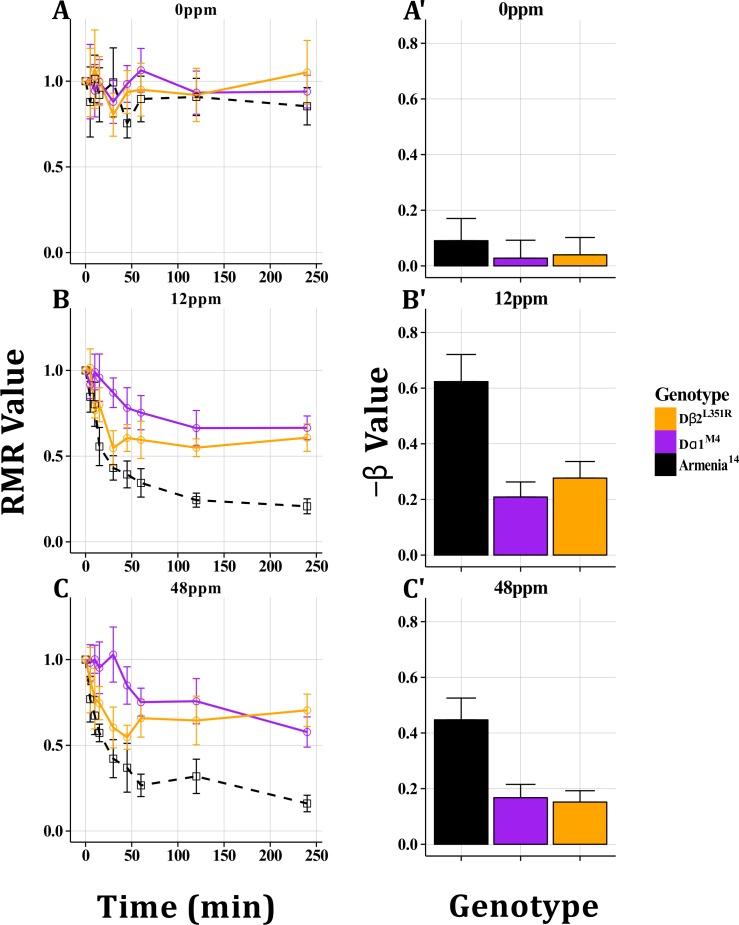
Fig 5. Imidacloprid Resistance in nAChR Mutants.
Armenia14, Dα1 M4 and Dβ2 L351R were tested using the Wiggle Index. At 0ppm (A, A’), no significant differences were observed between genotypes. As measured by Response Time, End Point RMR values and GLM analysis at 12 and 48ppm imidacloprid (B, B’, C, C’) Dα1 M4 responded the least, Dβ2 L351R displayed an intermediate phenotype and Armenia14 responded the most. All plots display mean RMR or β values with 95% confidence intervals.

