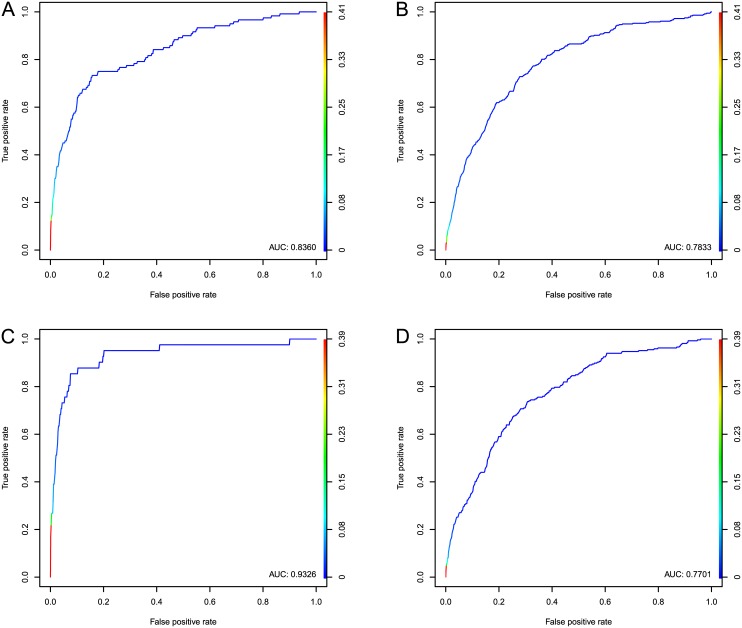
Fig 4. ROC curves of predictions from the stepped-down models described in Tables 3 and 4.
(a) shows genes contained in the integrated BRCA pathway, (c) shows genes contained in the GBM KEGG pathway, (b) and (d) show prediction of causal genes on an independent dataset: the COSMIC cancer gene census. Color bars on the right axes denote thresholds on the prediction score; the color along each ROC curve shows the true and false positive rate at each threshold value.

