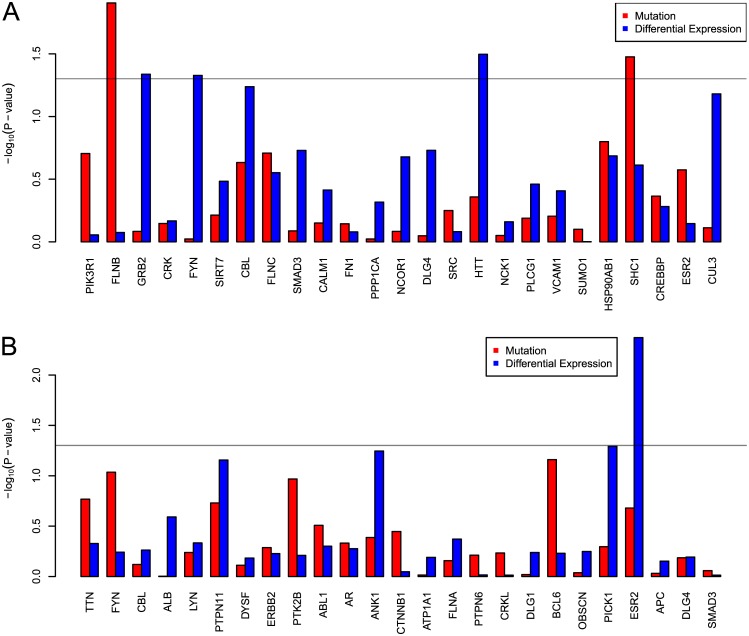
Fig 11. Log-rank P-values of differences in patient outcome (survival), using top-scoring genes that are not present each disease’s respective pathway.
BRCA is shown in (a); GBM is shown in (b). For each gene, distinct tests are performed using mutation and differential expression status to separate the samples into two groups. −log10(log-rank P-value) is plotted on the y-axis. The horizontal grey line denotes the 0.05 P-value cutoff.

