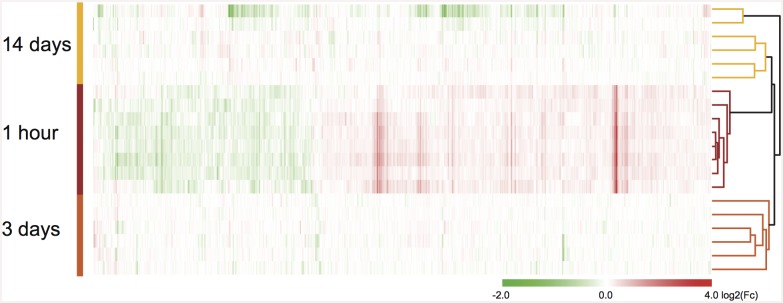
Fig 2. Hierarchical clustering analysis of mRNA expression after eFS.
Hierarchical clustering analysis of differentially expressed genes (930) in all experimental littermate couples (1 hour, 3 and 14 days post-eFS). Rows depict differential expression levels per HT/NT littermate couple, per time-point after eFS. Clustering was performed based on gene and sample clustering using Pearson correlation on average linkage. Tree cluster, right from heat-map, shows hierarchical distance between samples from the different time points. Differential gene expression (log2(Fc) between HT/NT littermate couples is shown in the heatmap as upregulated (red), downregulated (green), or no change (white) according to colored-scale bar.

