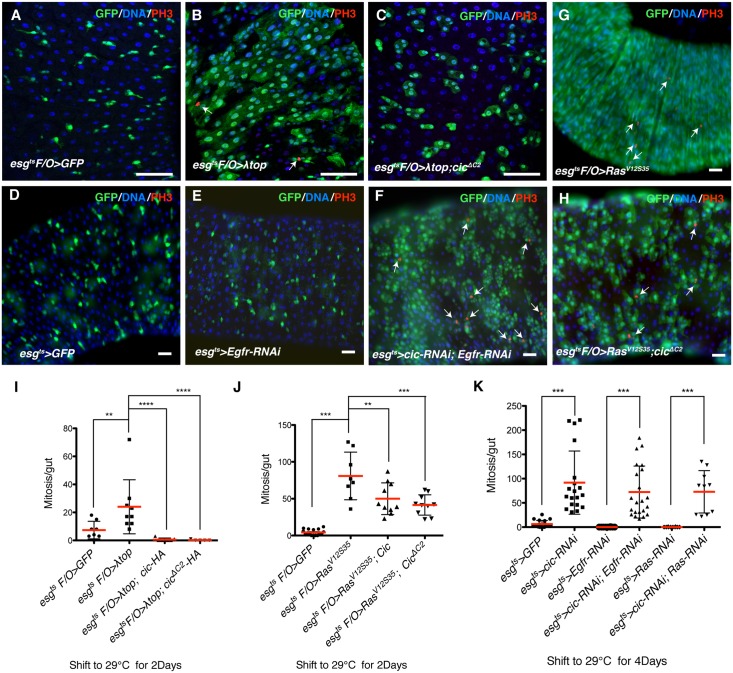
Fig 2. Cic regulates ISC proliferation as a downstream effector of EGFR signaling.
(A–C) Results of the λtop and cic epistasis tests, carried out using the esg ts F/O system, to co-express the indicated transgenes with GFP for 2 days at 29°C. (A) Control of adult midgut (B) λtop overexpresssing midgut (C) λtop and cic ΔC2 co-overexpresssing midgut. GFP+ clones (green) expressing λtop were much smaller when cic ΔC2 was co-overexpressed. Samples stained with anti-PH3 (red) and DAPI (blue). (D-F) Results of the epistasis test between cic and egfr, carried out using the esg ts system to express the indicated transgenes for 4 days at 29°C. (D) Control adult midgut, (E) Egfr-RNAi expressing midgut, (F) Egfr-RNAi and cic-RNAi co-expressing midgut. The number of GFP+ cells (green) still promoted by depleting cic in EGFR/Ras inactivated background. Samples were stained with anti-PH3 (red) and DAPI to visualize nuclei. (G-H) Results of epistasis tests between Ras V12S35 and cic, carried out using the esg ts F/O system. The transgenes were induced for 2 days at 29°C (G) Ras V12S35 over-expressing midgut (H) Ras V12S35 and cic ΔC2 co-over expressed midgut. Size of GFP+ clones (green) in Ras V12S35 and cic ΔC2 co-overexpressing midgut was significantly reduced. Samples were stained with anti-PH3 (red) and DAPI to visualize nuclei. (I-K) ISC mitoses as quantified by scoring PH3+ cells. (I) Quantification of ISCs mitoses for the λtop and cic epistasis test. The increase in mitoses induced by λtop was completely suppressed by cic or cic ΔC2 over expression. (J) Quantification of ISC mitoses from Ras V12S35/cic epistasis tests. The increase in mitosis induced by Ras V12S35 was partially suppressed by cic or cic ΔC2 over expression. (K) Quantification of ISCs mitosis in cic and either Egfr or Ras double knock down midguts. The increase in ISC mitoses induced by cic-RNAi is still observed when either Egfr or Ras RNAi is also expressed. Error bars represent standard deviations. Statistical significance was determined by Student’s t test (*p<0.05, **p<0.01, ***p<0.001, ****p<0.0001). Scale bars represent 50μm (A-H).

