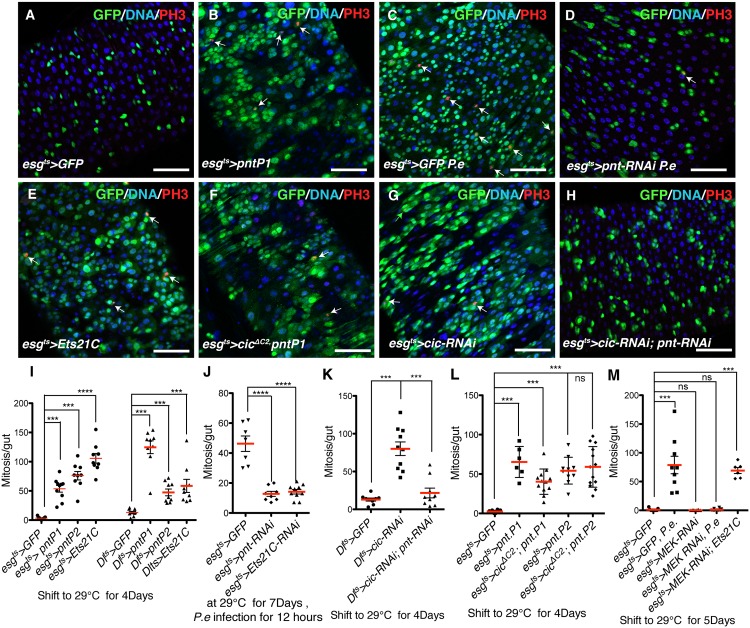
Fig 6. Cic controls ISC proliferation by regulating pnt transcription.
(A–E) Effects caused by pntP1 overexpression and RNAi’s. Transgenes were induced using the esg ts system at 29°C for 4 days, and samples were stained for GFP (green), DNA (blue) and mitoses (PH3, red). White arrows pointing out PH3 signals. (A) Control adult midgut. (B) pntP1 overexpressing midgut after 4 days induction at 29°C. (C) Control midgut after 12 hours P.e. infection. (D) pnt knockdown midgut after 12 hours P.e. infection. Fewer GFP+ and PH3+ cells are observed. (E) Ets21C overexpressing midgut, showing more PH3+ ISCs (arrows) and GFP+ ISCs and EBs (green). (F-H) Ectopic expression or loss of pnt bypasses ISC phenotypes caused by cic overexpression or depletion. (F) pnt and cic ΔC2 co-over-expressing midgut after 4 days induction at 29°C. GFP+ progenitor cells were still able to proliferate. (G) cic knockdown adult midgut and (H) pnt, cic double knockdown midgut. The increased number of progenitor cells marked by GFP upon cic knockdown was decreased by also knocking down pnt. (I-L) Quantification of PH3+ cells in adult midguts of the indicated genotypes. (I) pntP1, pntP2 or Ets21C overexpression driven by esg ts or Dl ts. All the pntP1, pntP2 and Ets21C overexpressing midguts contained more dividing ISCs. (J) pnt or Ets21C knockdown midguts after P.e. infection. ISC mitoses caused by P.e. infection were reduced in pnt or Ets21C knockdown midguts. (K) pnt and cic knock down using Dl ts system. Fewer mitotic ISCs were observed in the pnt and cic double knockdown midgut than the cic knockdown midgut. (L) pnt and cic ΔC2 co-overexpressing midguts. cic ΔC2 overexpression could not inhibit ISC mitoses caused by pnt overexpression. (M) Quantification of PH3+ cells from adult midguts following P.e. infection. MEK-RNAi completely blocked infection-driven ISC mitoses, but could not inhibit ISC proliferation driven by overexpressed Ets21c. Statistical significance was determined by Student’s t test (*p<0.05, **p<0.01, ***p<0.001, ****p<0.0001). Error bars in each graph represent standard deviation. Scale bars represent 50μm.

