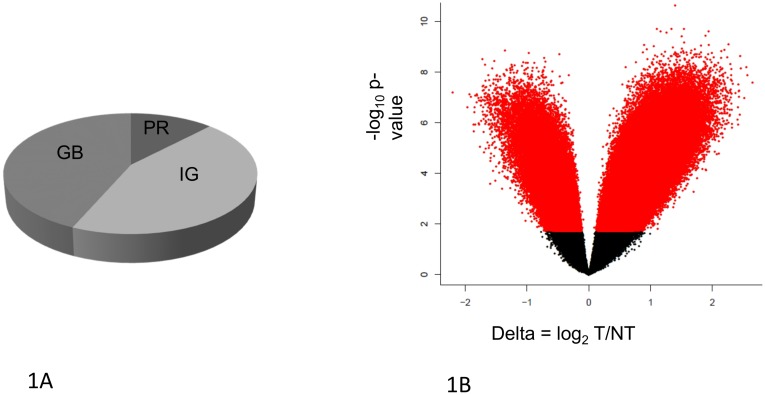
Fig 1. The genome compartment represented on the HELP Nimblegen microarray and statistically significant DM loci.
(A) Approximately 91% of the 1.2 million loci represented on the HELP microarray are located in gene body (GB) and intergenic (IG) regions, with a small minority (9%) of the loci located within promoters (PR). (B) Statistical significance (Y-axis) vs. delta (X-axis) (magnitude) of DM. Delta (X-axis) indicates the difference in methylation between tumor (T) vs non-tumor (NT) at a given locus. Loci hypermethylated in T relative to NT have delta < 0. P-value (Y-axis) is calculated based on Benjamini Hochberg adjusted FDR. At FDR p < 0.05, 433,505 loci across all genomic compartments are found to be differentially methylated in T vs NT. Red dots indicate statistically significant DM loci.

