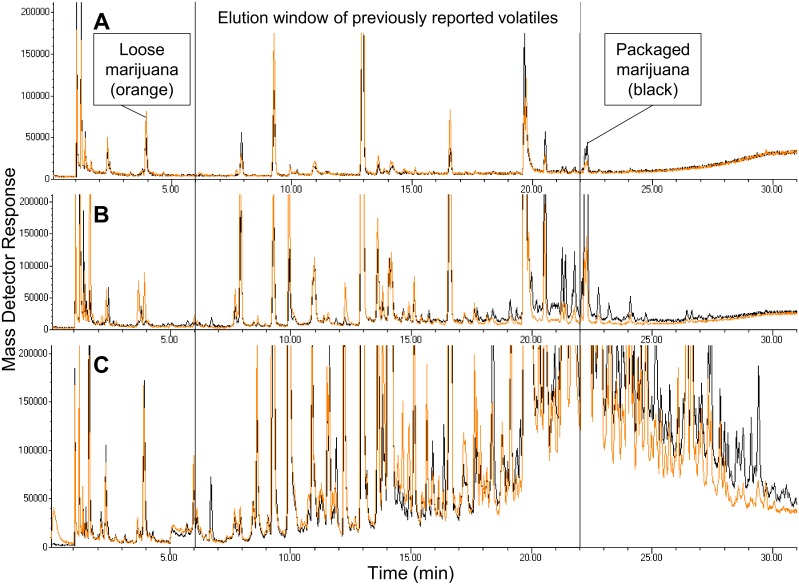
Fig 1. Effects of sampling time, as total ion chromatograms (TICs), of volatiles emitted from marijuana.
Orange signal represents volatiles emitted from 1 g desiccated marijuana, loose in a 473 mL glass jar. Black signal represents volatiles emitted from 1 g desiccated marijuana, in a plastic zip-top bag, in a 473 mL glass jar. The boxed retention time widow highlights where volatiles, from previously published articles, would elute from the analytical column of the MDGC-MS-O. The set of 3 TICs represent volatiles extracted over (A) 5 min, (B) 1 h, and (C) 68 h resulting 20, 54, and 101 chromatographic peaks (orange signal), and 25, 39, 108 chromatographic peaks (black signal), respectively. See S2 and S3 Tables for the complete summary of identified compounds.

