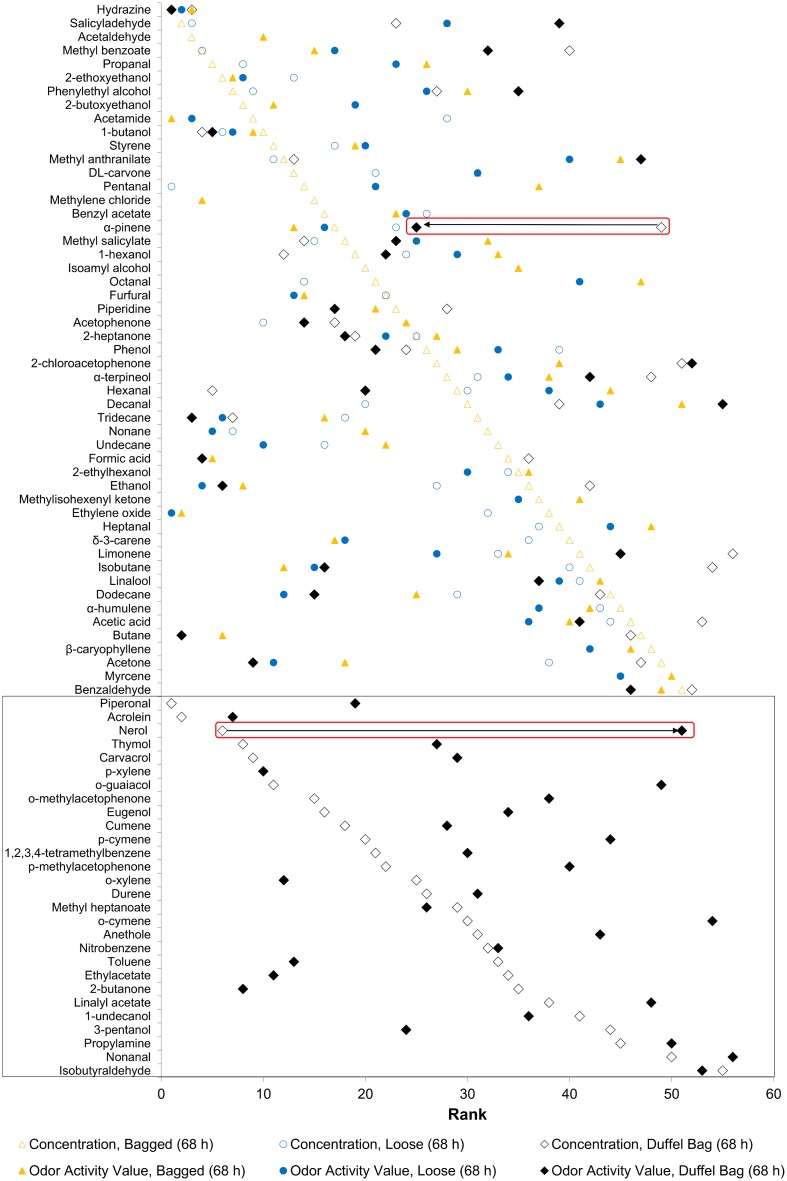
Fig 3. Dot plot reporting shift in rank of volatiles emitted from marijuana by surrogate concentration vs. calculated OAV.
Markers represent VOC emitted from all marijuana samples and extracted from headspace by SPME over 68 h at room temperature. Compounds are ranked by surrogate concentration vs. calculated OAV using standardized ODT in air from Devos, et al. (1990) [35]. Data representing bagged and loose marijuana sampled for 68 h are similar to S5 Fig. Rank value (horizontal-axis) of 1 indicates low surrogate concentration or low OAV; rank of 60 indicates high surrogate concentration or high OAV. The general trend is a shift in rank between surrogate concentration and odor activity value. Nerol has a rank of 6 by surrogate concentration and has a rank of 51 by OAV (bottom red box); α-pinene has a rank of 49 by surrogate concentration and has a rank of 25 by OAV (top red box). Values of rank for each VOC are given in S6 Table. Compounds in the black box highlight VOC that were detected in fresh marijuana and permeated through a duffel bag, not detected or permeated in desiccated marijuana.

