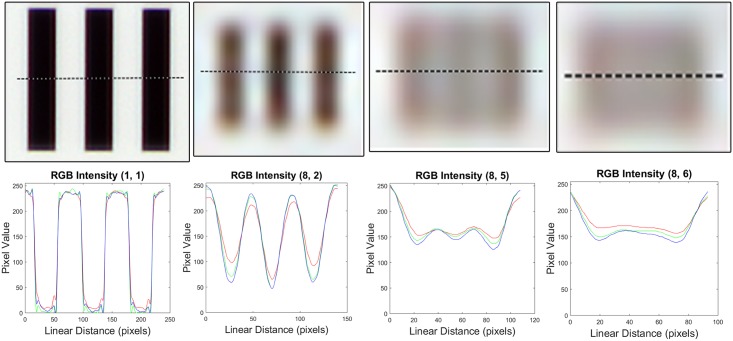
Fig 3. Pixel intensity profiles, calculated from four different sets of bars in the USAF three-bar resolution test chart.
Intensity values (RGB) calculated from horizontal lines across regions indicated with red bounding boxes in Fig 2. From left to right: Group 1, element 1; group 8, element 2; group 8 element 5 (smallest resolvable); group 8, element 6.

