
Fig 2. Effect of BRP treatment for 48 h on NO production (in A and C) and cell viability (in B and D) of RAW 264.7 non-activated cells (A and B) and activated with 500 ng/ml LPS (C and D).
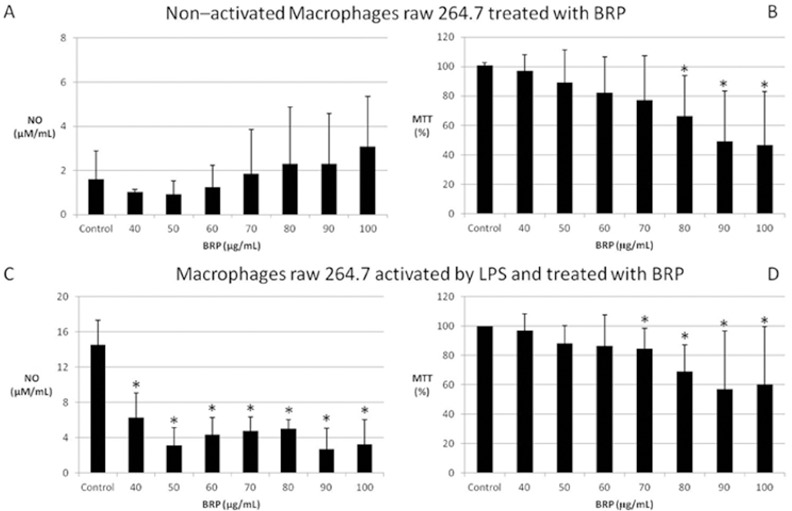
Results are expressed as means followed by standard deviation of three independent experiments performed in triplicate. (*) Indicates statistically significant difference compared to control (DMSO) group by Analysis of variance (One-way ANOVA, p <0.05).