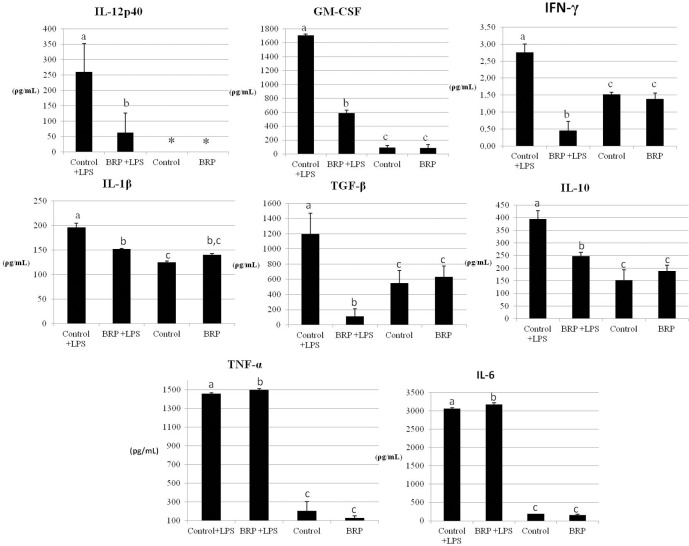
Fig 3. IL-12, GM-CSF, IFN-γ, IL-1β, IL-10, TGF-β, TNF- α and IL-6 levels (pg/ml) in the supernatant of LPS (500 ng/mL) activated RAW 264.7 cells treated with BRP (50 μg/mL in DMSO) for 48 hours.
Control + LPS: cells treated only with LPS and DMSO. Control: cells treated with DMSO. BRP: cells treated only with BRP. (*) Indicates cytokine levels below the detection limit. Same letters mean no statistical difference while different letters mean statistically significant difference between the two bars by analysis of variance (One-Way ANOVA, p <0.05).

