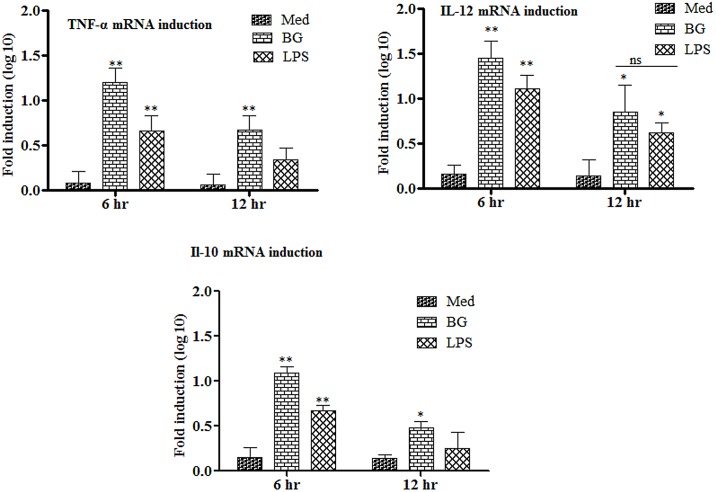
Fig 5. Kinetics of cytokine mRNA transcription from MoDCs treated with either BGs or LPS.
RNA was extracted and gene transcription was quantified by qRT-PCR at 0, 6 and 12 h. Results are expressed as fold induction (log10) of cytokine mRNA transcription by BGs or LPS stimulated cells compared to the media treated (Med) cells. GAPDH was used as an internal control and mRNA levels at 0 h was used as calibrator. Histograms represent mean cytokine levels and bars represent standard deviation of three independent experiments. *p < 0.05, **p<0.01, ns = non-significant.

