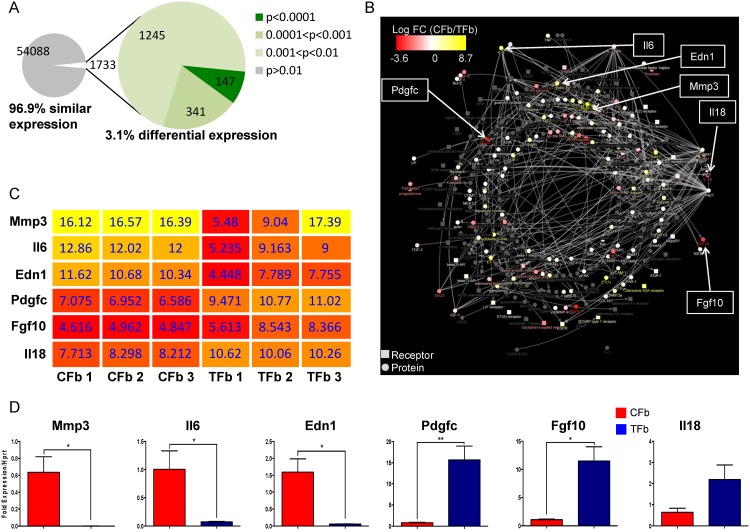
Fig 6. A case study of applying CARFMAP to facilitate cardiac gene discovery from expression profiles.
(A) Pie chart summarising the p-value (unpaired t-test) of the normalised microarray dataset. 3.1% of the transcriptome has p-value < 0.01, which indicates differential expression between CFb and TFb. (B) CARFMAP overlaid with gene expressions of CFb and TFb. Node colours represents the log fold-change of the genes encoding the proteins and receptors. Note that only proteins and receptors are displayed. The log fold-change reveals CFb-specific genes that are strongly up-regulated or down-regulated with reference to TFb. (C) Heat map showing the differentially expressed genes from the microarray (with p<0.01) and CARFMAP. (D) qPCR validation of the candidate genes revealed by CARFMAP. Means and standard deviations (n = 3) are shown. (*): p<0.05; (**): p<0.005 (unpaired t-test).

