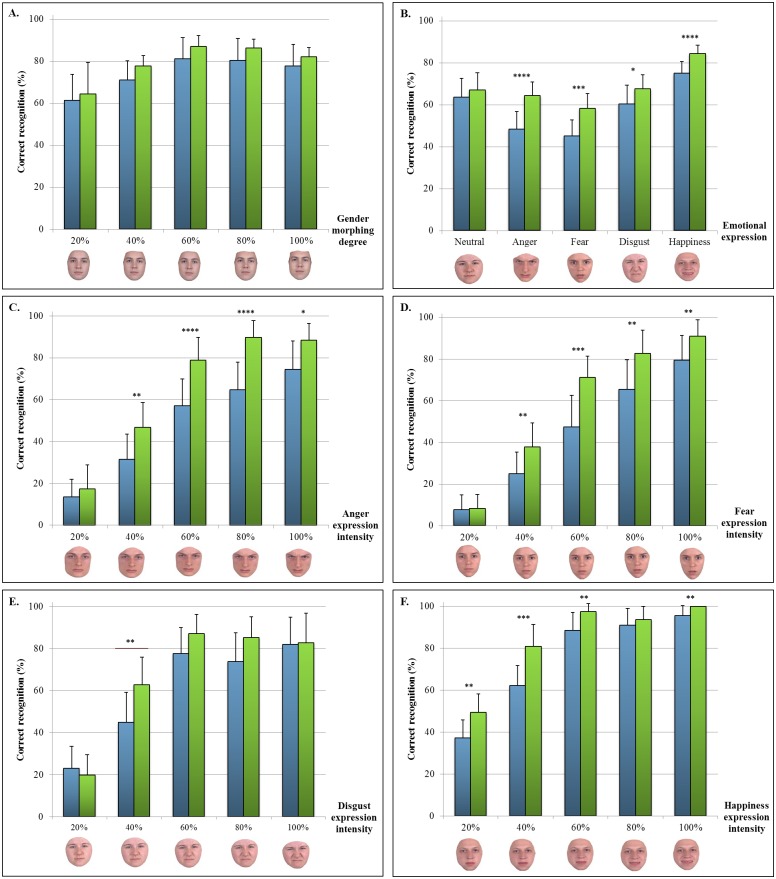
Fig 2. Mean performance on cognitive tasks.
A: Gender recognition; B: Emotion recognition; C: Anger recognition; D: Fear recognition; E: Disgust recognition; F: Happiness recognition. Examples of morphed faces depicting various intensities of the emotional expression are shown at the bottom of each graph. Blue: patients (AD at the MCI stage or at the mild dementia stage); Green: controls. *p <.05; **p<10–2; ***p<10–3; ****p<10–4.

