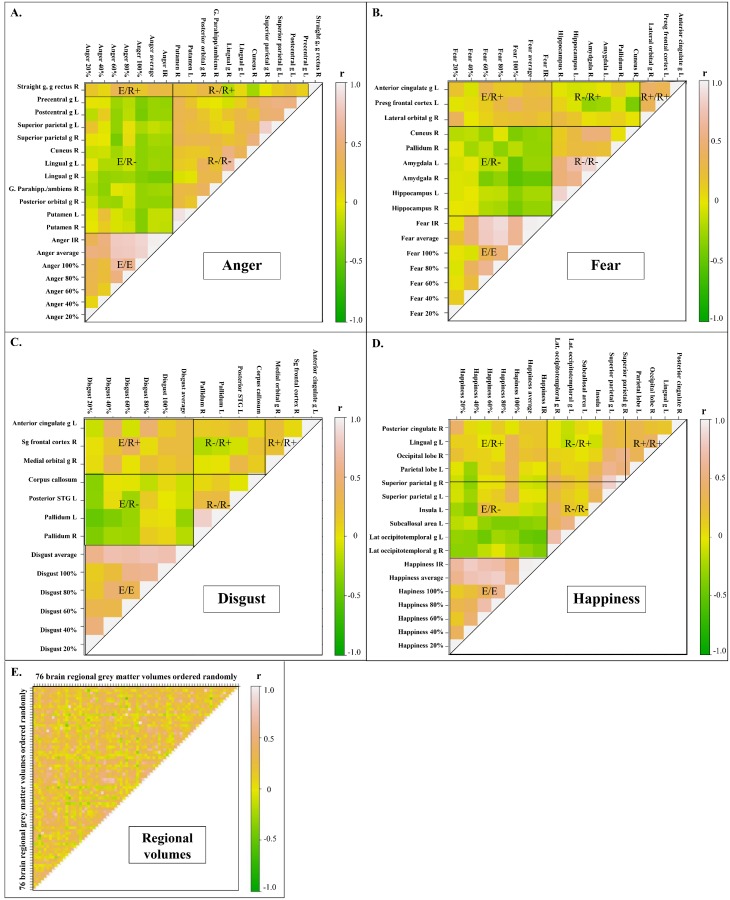
Fig 4. Correlations between neuroanatomical structure volumes and emotion recognition performance.
The plots show the correlation coefficients (r) between the different conditions. Only the regions which were significantly correlated (uncorrected p-values) with the recognition of an emotion are presented. E = Emotion recognition performance; R+ = Regional volume positively correlated with the recognition of emotions; R- = Regional volume negatively correlated with the recognition of emotions; e.g. E/R+ = correlation between emotion recognition performance and regional volumes positively correlated with the recognition of emotions. R = right, L = left, IR: impaired recognition.

