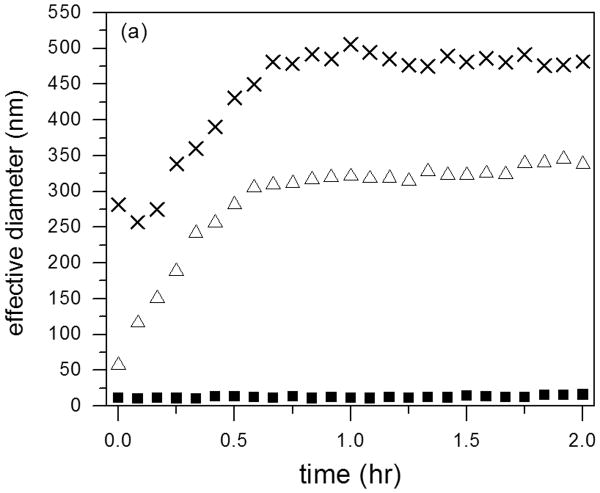
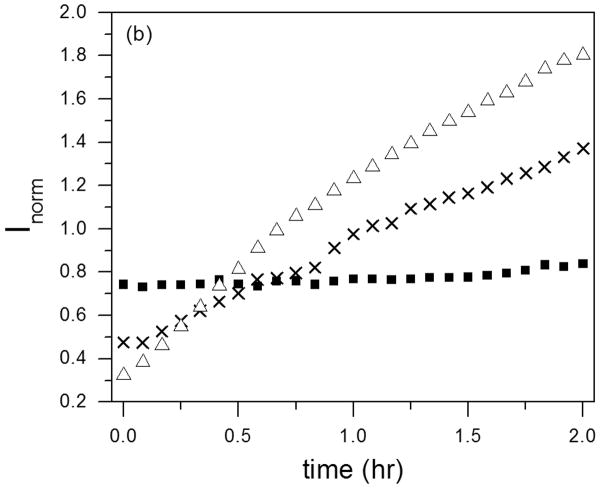
Figure 9.
Effect of cysC aggregation state on Aβ aggregation rate as measured by DLS. Effective hydrodynamic diameter (a) and normalized scattering intensity (b) were measured for Aβ alone (△), Aβ incubated with monomeric cysC (X), or Aβ incubated with oligomeric cysC ■. Aβ concentration was 28 μM. CysC concentration (monomeric or oligomer-rich) was 14 μM on a monomer basis. Representative of 3 repeats. The scattered intensity is normalized to account for the different concentrations of total protein in the samples.


